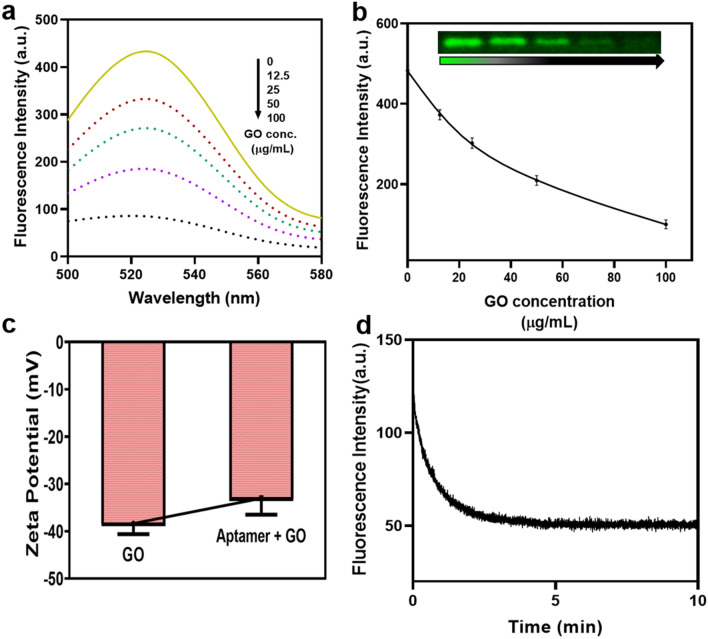
Figure 3.
Graphene oxide and aptamer optimization. (a) Fluorescent spectra of aptamer with various concentration of GO. (12.5 µg/mL, 25 µg/mL, 50 µg/mL and 100 µg/mL) (b) Quantitative and qualitative (agarose gel) results of aptamer fluorescence with increasing concentration of GO. Inset: Peak fluorescence change shows a linear relationship with Graphene oxide concentration. (c) Zeta potential of Apt and Apt-GO (d) Time kinetics of fluorescence quenching in presence of 50 µg/mL.

