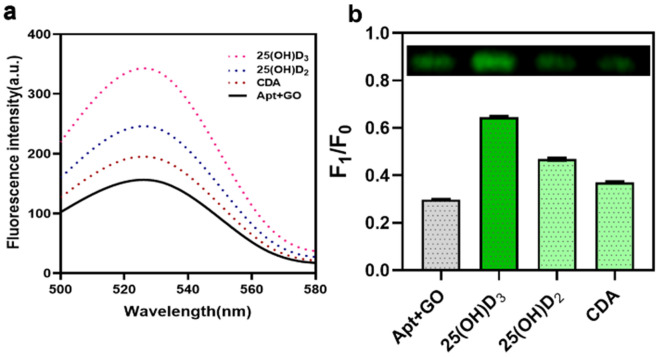
Figure 5.
Specificity evaluation for 25(OH)D3 detection. (a) Aptamer binding specificity check with different negative controls 25(OH)D2 and CDA. Maximum fluorescence intensity was observed in 25(OH)D3 when compared to the other compounds proving the specificity of the aptamer. (b) Quantitative and qualitative analysis was also proved using 3% agarose gel electrophoresis. [Apt – 100 nM, GO-50 µg/mL and 25(OH)D3-5 µg/mL] F0: only Aptamer which is 1 and F1: Apt + GO in the presence and absence of compounds. The comparison of negatives was expressed as Mean ± S.D., n = 3.

