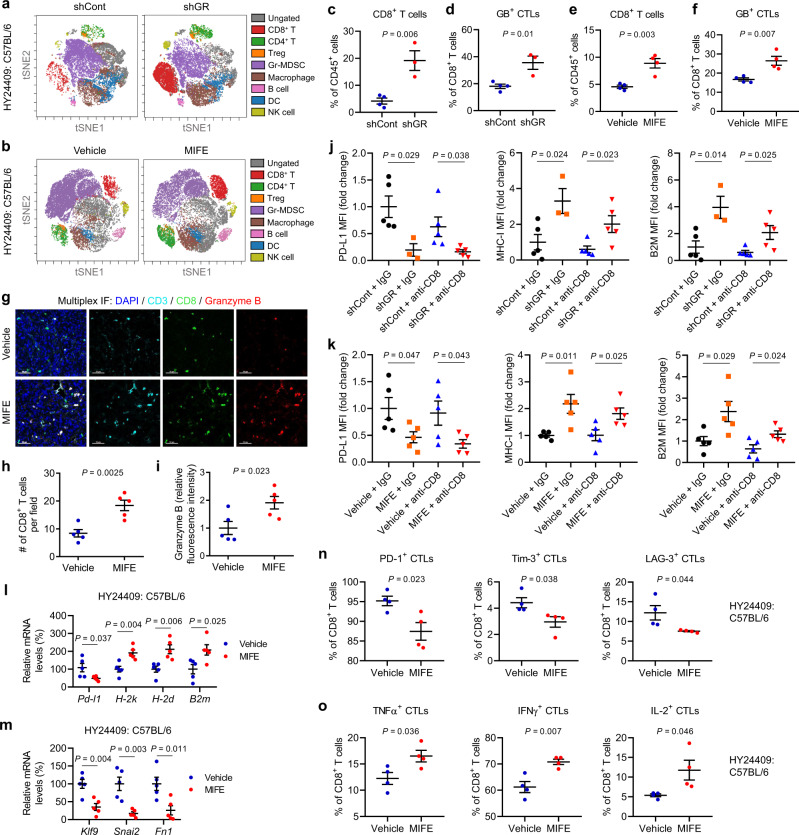
Fig. 4. Tumor cell-specific GR depletion or pharmacologic GR inhibition promotes anti-tumor immunity in PDAC.
a, b CyTOF-based immune profiling of orthotopic HY24409 tumors expressing control shRNA or GR shRNA (a), and of vehicle- and MIFE-treated orthotopic HY24409 tumors (b). Representative viSNE plots were colored by immune cell populations. c, d Quantification of CD8+ T cells (c) and granzyme B (GB)+ CTLs (d) in orthotopic HY24409 tumors expressing control shRNA (n = 4 mice) or GR shRNA (n = 3 mice). e, f Quantification of CD8+ T cells (e) and granzyme B (GB)+ CTLs (f) in vehicle- and MIFE-treated orthotopic HY24409 tumors. n = 4 mice. g–i Multiplex immunofluorescent staining of CD3, CD8, and granzyme B in vehicle- and MIFE-treated orthotopic HY24409 tumors (g), and quantification of CD8 (h) and granzyme B (i) signals. Scale bars, 50 μm. n = 5 mice. j Flow cytometric analysis of cell-surface PD-L1 (left), MHC-I (H-2Kb) (middle), and B2M (right) levels in cancer cells sorted from orthotopic HY24409 tumors expressing control shRNA or GR shRNA, with or without CD8+ T cell depletion. n = 5, 3, 5, and 5 mice from left to right. k Flow cytometric analysis of cell-surface PD-L1 (left), MHC-I (H-2Kb) (middle), and B2M (right) levels in cancer cells sorted from vehicle- and MIFE-treated orthotopic HY24409 tumors, with or without CD8+ T cell depletion. n = 5 mice. l qPCR analysis of Pd-l1, H-2k, H-2d, and B2m in vehicle- and MIFE-treated orthotopic HY24409 tumors. n = 5 mice. m qPCR analysis of known GR-activated target genes in vehicle- and MIFE-treated orthotopic HY24409 tumors. n = 5 mice. n Quantification of PD-1+, Tim-3+, and LAG-3+ CTLs in vehicle- and MIFE-treated orthotopic HY24409 tumors. n = 4 mice. o Quantification of TNFα, IFNγ, and IL-2 expression in intratumoral CD8+ T cells from orthotopic HY24409 tumors, after ex vivo phorbol myristate acetate (PMA)/ionomycin stimulation. n = 4 mice. Statistical significance in c–f and h–o was determined by a two-tailed unpaired t-test. Error bars are s.e.m. Source data are provided as a Source Data file.

