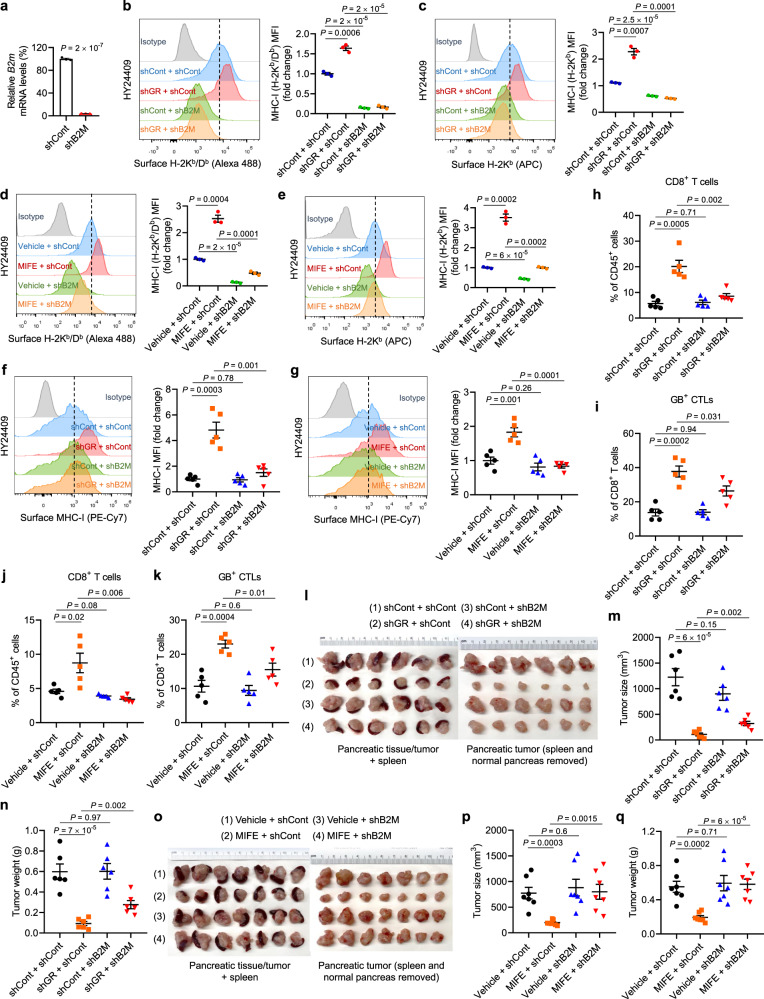
Fig. 5. GR-mediated regulation of MHC-I is required for the anti-tumor effect of GR depletion or inhibition.
a qPCR analysis of B2m in HY24409 cells transduced with control shRNA or B2M shRNA. n = 3 technical replicates. b, c Representative flow cytometry plots and quantification (by MFI: mean fluorescence intensity) of cell-surface H-2Kb/Db (b) and H-2Kb (c) in HY24409 cells transduced with GR shRNA and B2M shRNA, alone or in combination. Cells were treated with IFNγ (10 ng ml−1, overnight). n = 3 biological replicates. d, e Representative flow cytometry plots and quantification of cell-surface H-2Kb/Db (d) and H-2Kb (e) in HY24409 cells transduced with control shRNA or B2M shRNA, with or without mifepristone (MIFE) treatment (20 μM, 48 h). Cells were treated with IFNγ (10 ng ml−1, overnight). n = 3 biological replicates. f, g Representative flow cytometry plots and quantification of cell-surface MHC-I (H-2Kb) in orthotopic HY24409 tumors of the indicated groups. n = 5 mice. h–k Quantification of CD8+ T cells (h, j) and granzyme B (GB)+ CTLs (i, k) in orthotopic HY24409 tumors of the indicated groups. n = 5 mice. l, m Endpoint (22 days after inoculation) tumor images (l), tumor size (m), and tumor weight (n) of C57BL/6 mice bearing orthotopic pancreatic tumors. Mice were implanted with 8 × 10⁴ luciferase-labeled HY24409 cells transduced with GR shRNA and B2M shRNA, alone or in combination. n = 6 mice. o–q Endpoint (22 days after inoculation) tumor images (o), tumor size (p), and tumor weight (q) of C57BL/6 mice bearing orthotopic pancreatic tumors. Mice were implanted with 8 × 10⁴ luciferase-labeled HY24409 cells transduced with control shRNA or B2M shRNA, and were treated with vehicle or mifepristone (MIFE) twice every 3 days. n = 7 mice. Statistical significance in a–k, m, n, p, and q was determined by a two-tailed unpaired t-test. Error bars are s.e.m. Source data are provided as a Source Data file.

