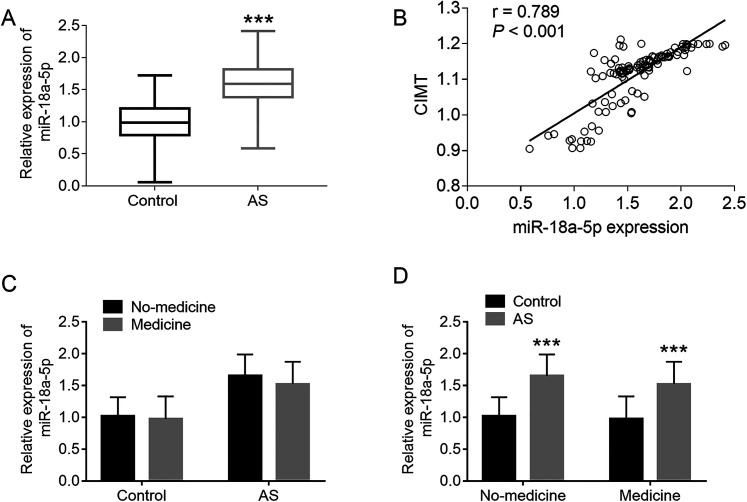
Figure 1.
The expression level of Serum miR-18a-5p in AS patients and the correlation study between miR-18a-5p expression and CIMT. (A) Relative expression levels of serum miR-18a-5p in healthy controls and AS patients, ***P < .001. (B) Correlation between miR-18a-5p expression level and CIMT in AS patients, r = 0.789 ***P < .001. (C) Comparison of miR-18a-5p levels between medicine and no-medicine groups for both control and AS groups. (D) In medicine or no-medicine group, comparison of miR-18a-5p levels between control group and AS group. ***P < .001, compared with control group.

