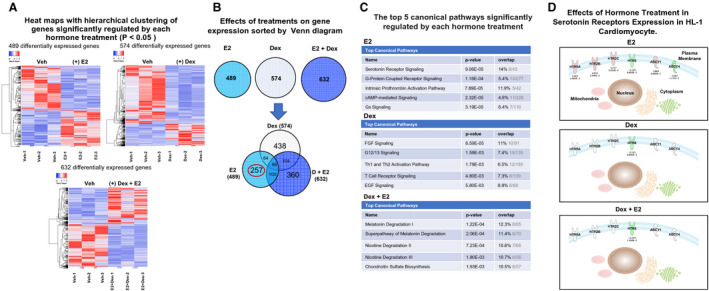
Figure 1. Glucocorticoids alter estrogen transcriptional effects in HL‐1 cardiomyocytes.

HL‐1 cells were treated with vehicle (Veh), 10 nmol/L estradiol (estrogen [E2]), 100 nmol/L dexamethasone (Dex), or 100 nmol/L dexamethasone+10 nmol/L estrogen (Dex+E2). mRNA was isolated and analyzed using a whole mouse genome 4×44 multiplex format oligo array (Agilent) for gene expression. A, Heat maps were generated with the online software Heatmapper (http://www2.heatmapper.ca) to visualize the differences in the gene expression of cells treated with each hormone and their combination. Blue indicates downregulation, and red indicates upregulation. B, The estrogen‐regulated, dexamethasone‐regulated, and estrogen+dexamethasone–regulated genes within each group were sorted by Venn diagrams that were generated using the Ingenuity Pathway Analysis software. Each hormone treatment regulated a similar number of genes; however, each treatment led to the regulation of a significant number of unique genes, and dexamethasone+estrogen significantly altered the transcriptional response to estrogen and dexamethasone alone. The hormone combination treatment inhibited the effects of dexamethasone in the regulation of 438 genes and of estrogen in the regulation of 257 genes (circled in red). In addition, dexamethasone+estrogen had unique effects on the expression of 360 genes. C, Results from microarray analysis of each hormone treatment were loaded into Ingenuity Pathway Analysis software. Estrogen treatment significantly regulated an important number of genes associated with serotonin receptor (5‐HTR) signaling (ranked top 1). Dexamethasone treatment led to the regulation of genes involved in different cellular and molecular biological pathways compared with estrogen. Dexamethasone+estrogen cotreatment alter the pathways that are regulated by a single estrogen treatment in cardiomyocytes. D, Estrogen altered the expression of 4 subtypes of 5‐HTRs in HL‐1 cardiomyocytes: 5‐HTR2B (5‐HTR2 subtype B), 5‐HTR2C (5‐HTR2 subtype C), and 5‐HTR5 (5‐HTR2 subtype A) and 5‐HTR6. The figure displays the effects of each hormone treatment on the expression of each gene. Estrogen also affects the expression of ADCY1 and ADCY4. Red indicates upregulation, and green indicates downregulation. ADCY1 indicates adenylate cyclase 1; ADCY4, adenylate cyclase 4; cAMP, cyclic adenosine monophosphate; EGF, endothelial growth factor; FGF, fibroblast growth factor; Th1, T helper 1; and Th2, T helper 2.
