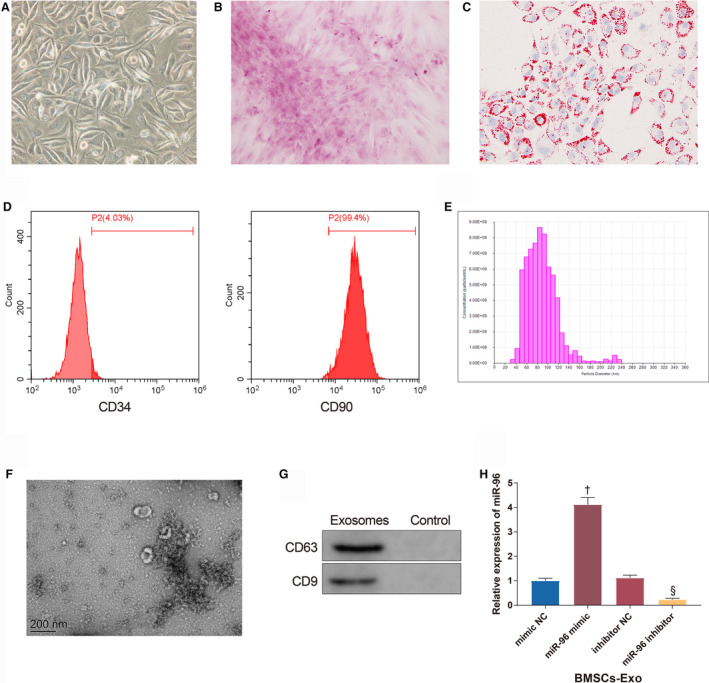
Figure 1. Successful isolation of bone marrow mesenchymal stem cell (BMSC)‐exosome.

A, The morphology of the third generation of BMSCs under a microscope (Scale bar=200 μm). B, Calcium nodules produced by BMSCs after osteogenic differentiation (Scale bar=200 μm). C, Lipid droplets produced by BMSCs after adipogenic differentiation (Scale bar=200 μm). D, The expressions of CD34 and CD90 tested by flow cytometry. E, the diameter distribution of particles extracted from BMSCs. F, Exosome sediments observed under a transmission electron microscope (200 nm). G, The expressions of CD63 and CD9. H, The expression of miR‐96 in BMSC‐exosome; n=3. BMSCs‐Exo indicates bone marrow mesenchymal stem cell‐exosomes; miR‐96, microRNA‐96; and NC, negative control. † P<0.05, compared with the mimic NC group; § P<0.05, compared with the inhibitor NC group; data were presented as mean±SD; data were analyzed using 1‐way ANOVA and the Tukey test was applied for post hoc multiple comparisons.
