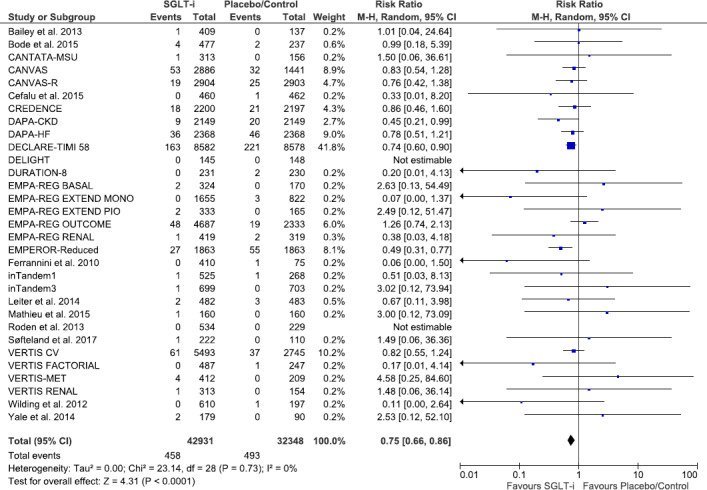
Figure 1. Forest plot comparing serious atrial fibrillation or atrial flutter events between patients on SGLT inhibitors vs placebo/control in randomized controlled trials.

Square markers represent point estimates of RR for individual studies, with square size representing proportional weight given to each study in the meta‐analysis. Horizontal lines indicate 95% CIs. The solid diamond represents the estimated 95% CI for effect size of all meta‐analyzed data. M‐H, Mantel‐Haenszel; RR, relative risk; and SGLT, sodium‐glucose co‐transporter.
