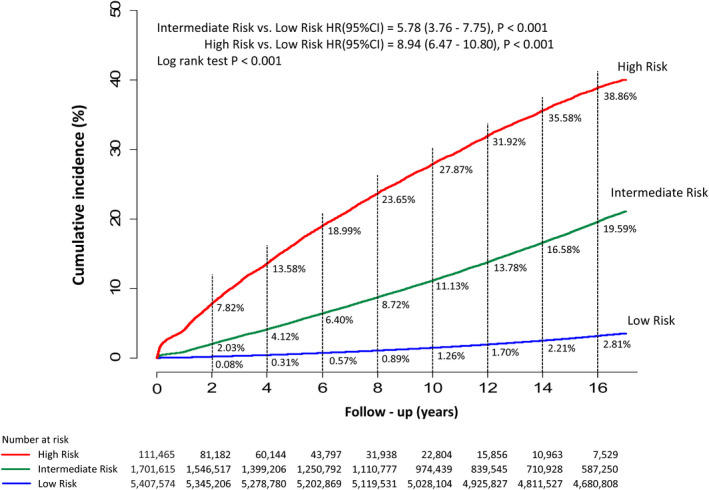
Figure 3. The cumulative incidence curves of incident AF of the low‐risk, intermediate‐risk, and high‐risk groups.

The 2‐year risks of AF were 0.08%, 2.03%, and 7.82% for the low‐risk, intermediate‐risk, and high‐risk groups, respectively. The 4‐year risks of AF were 0.31%, 4.12%, and 13.58% for the low‐risk, intermediate‐risk, and high‐risk groups, respectively. The 10‐year risks of AF were 1.26%, 11.13%, and 27.87% for the low‐risk, intermediate‐risk, and high‐risk groups, respectively. Compared with low‐risk patients, the HRs of incident AF were 5.78 (95% CI, 3.76–7.75) for the intermediate‐risk group and 8.94 (95% CI, 6.47–10.80) for the high‐risk group. AF indicates atrial fibrillation; and HR, hazard ratio.
