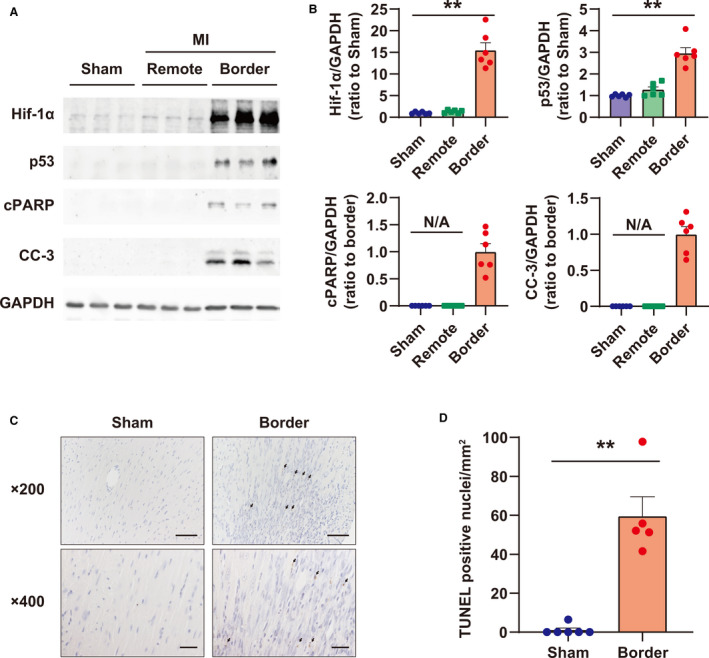
Figure 1. Characterization of the myocardium in the myocardial infarction (MI) border zone at day 5 after MI.

A, Western blots of Hif‐1α (hypoxia‐inducible factor‐1α), p53, cPARP (cleaved poly [ADP‐ribose] polymerase), and CC‐3 (cleaved caspase‐3) in the MI border zone. GAPDH (glyceraldehyde 3‐phosphate dehydrogenase) was used as a loading control. B, Quantification of Western blots shown in (A); n=6 in each group. **P<0.01, analyzed by Dunnett test vs sham. Data are shown as the ratio to sham group average or border group average. C, Representative images of terminal deoxynucleotidyl transferase‐mediated dUTP nick end‐labeling (TUNEL) staining in the MI border zone on day 5. The arrow indicates TUNEL‐positive nuclei. Bar = 50 μm in 200× images, and 20 μm in 400× images. D, Quantification of TUNEL‐positive cells in the MI border zone per square millimeter. Sham: n=6; MI border: n=5. **P<0.01 vs Sham, analyzed by Student t test. N/A indicates not applicable.
