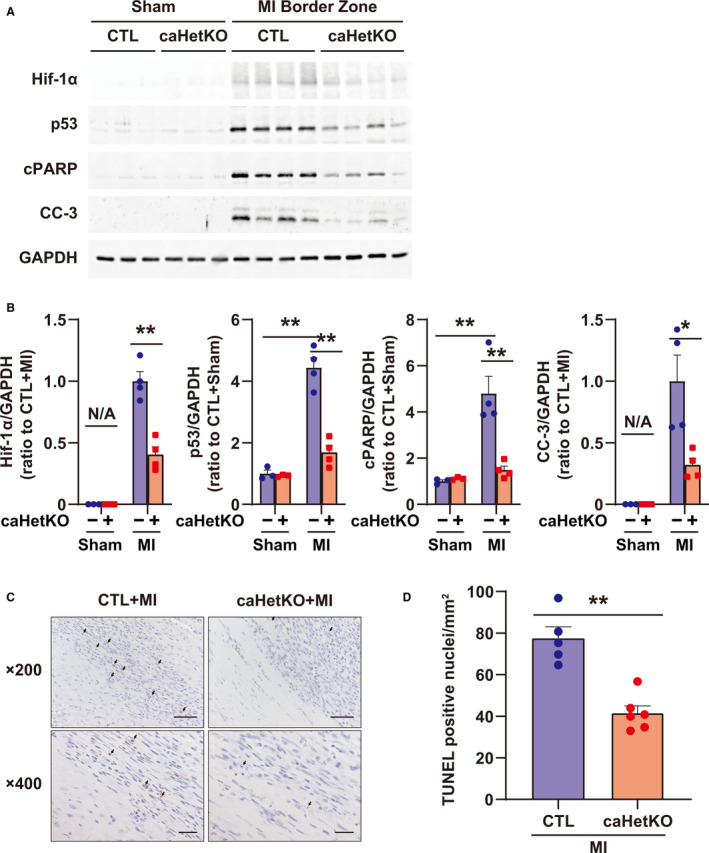
Figure 4. Hif‐1α (hypoxia‐inducible factor 1‐α), p53, and apoptosis in the myocardial infarction (MI) border zone of cardiomyocyte‐specific Hif‐1α hetero‐knockout (caHetKO) mice on day 5.

A, Expression of Hif‐1α, p53, cPARP (cleaved poly [ADP‐ribose] polymerase), and CC‐3 (cleaved caspase 3) in the MI border zone at day 5 after MI. GAPDH (glyceraldehyde 3‐phosphate dehydrogenase) was used as a loading control (CTL). B, Quantification of Western blots shown in (A); n=4 in each group. Data are shown as a ratio to CTL+sham or CTL+MI mice. C, Representative images of terminal deoxynucleotidyl transferase‐mediated dUTP nick end‐labeling (TUNEL)‐positive cells in CTL and caHetKO mice at day 5 after MI. D, Quantification of TUNEL‐positive cell count per square millimeter in CTL and caHetKO mice; n=5–6 in each group. The arrow indicates TUNEL‐positive nuclei. Bar = 50 μm in 200× images and 20 μm in 400× images. Data are shown as a ratio to the average of CTL+MI group. *P<0.05, **P<0.01 vs CTL, analyzed by 1‐way ANOVA, followed by Tukey post hoc test or Student t test (for Hif‐1α and CC‐3 in B and D). N/A indicates not applicable.
