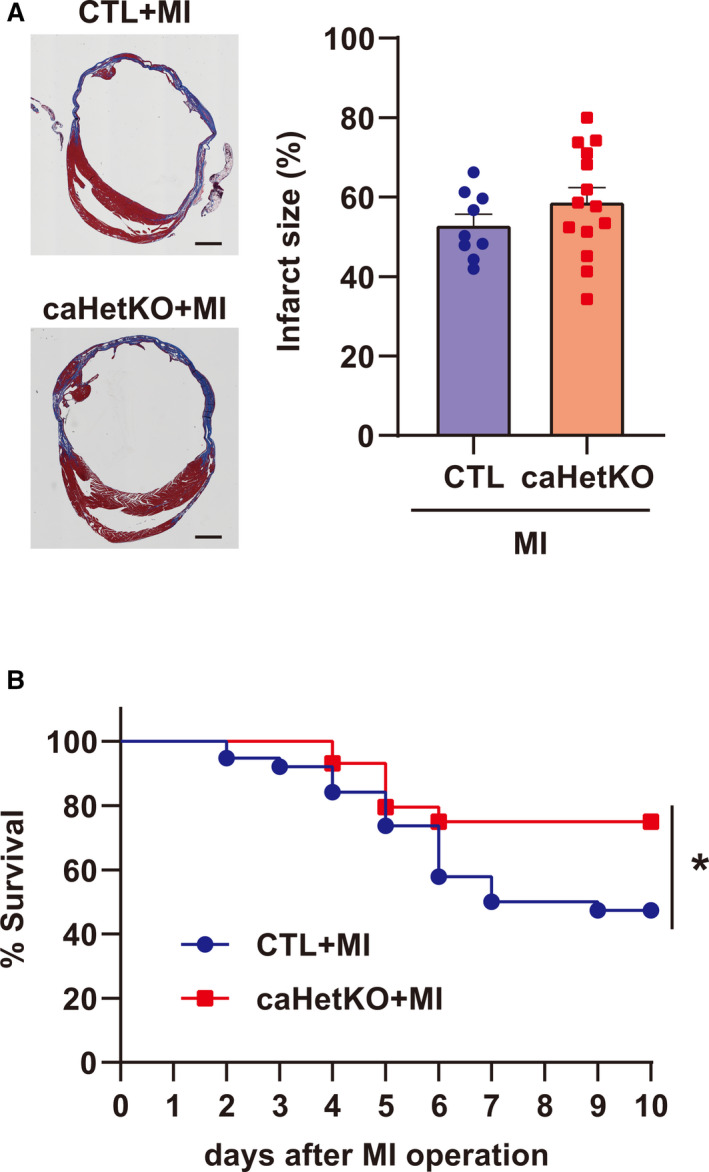
Figure 6. Infarct size and survival after myocardial infarction (MI) in cardiomyocyte‐specific Hif‐1α hetero‐knockout mice (caHetKO mice) until day 10.

A, Representative images demonstrating infarct size, and quantification of infarct size in control (CTL) and caHetKO mice after MI. CTL mice: n=9; caHetKO mice: n=14. Bar = 1 mm. B, Survival of CTL and caHetKO mice after MI. CTL mice: n=38; caHetKO mice: n=44. Survival analysis was performed using the Kaplan‐Meier method. Between‐group differences in survival were evaluated by the log‐rank test. *P<0.05 vs CTL+MI mice. Hif‐1α indicates hypoxia‐inducible factor 1‐α.
