
Figure 3. Risk of pulmonary embolism severity risk among subgroups in the matched cohort.
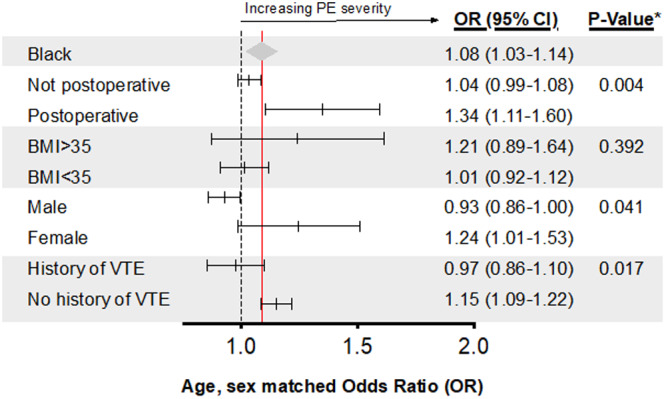
*P value of the interaction term. The dashed line corresponds to an OR of 1. The red line and the gray triangle corresponding to the overall OR and 95% CI for Black race in the matched cohort. Postoperative within 90 days of admission date. BMI indicates body mass index; OR, odds ratio; and PE, pulmonary embolism.