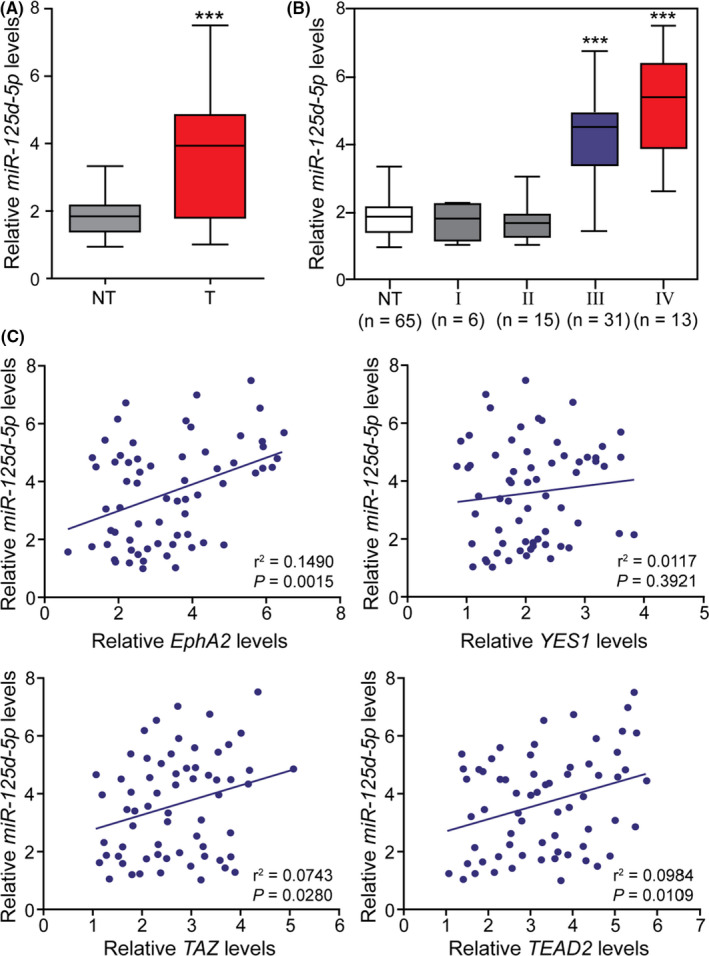
FIGURE 5.

Clinical correlations between miR‐125a‐5p and its targets in gastric cancers (GCs). (A) The expression of miR‐125a‐5p was detected in 65 GC tissues and noncancerous gastric tissues. (B) Expression levels of miR‐125a‐5p in GCs of different stages. (C) Correlations between miR‐125a‐5p levels and the expression levels of putative targets in GCs were demonstrated. NC, noncancerous gastric tissues; ***p < 0.001 compared with NC, stage I GCs, and stage II GCs
