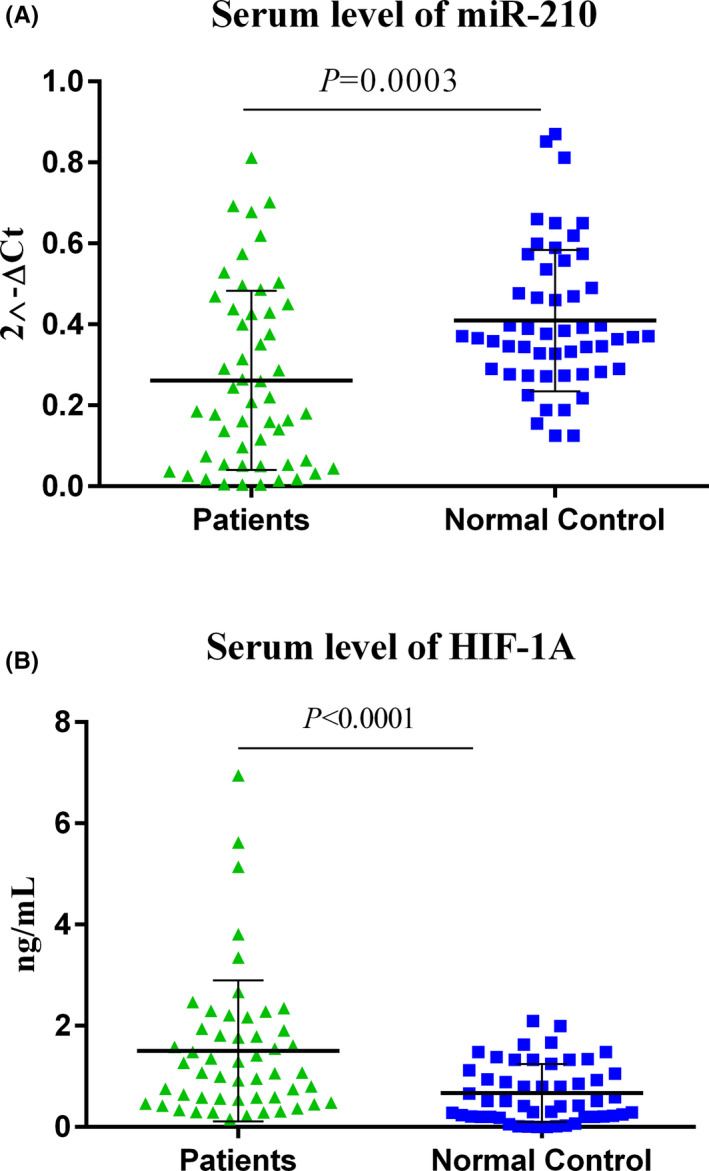
FIGURE 1.

The serum steady‐state concentration of miR‐210 and HIF‐1α levels; miR‐210 was down‐regulated in IS patients (A), while HIF‐1α was expressed in higher quantities (B). The calculations of the expression levels for miR‐210 were conducted by 2−ΔCt method. To compare the means between the two groups, students’ T‐test was used (Patients: 52, Healthy subjects: 52). Statistics on each scattered plot demonstrates Mean ± SD. The level of significant p‐values was 0.05
