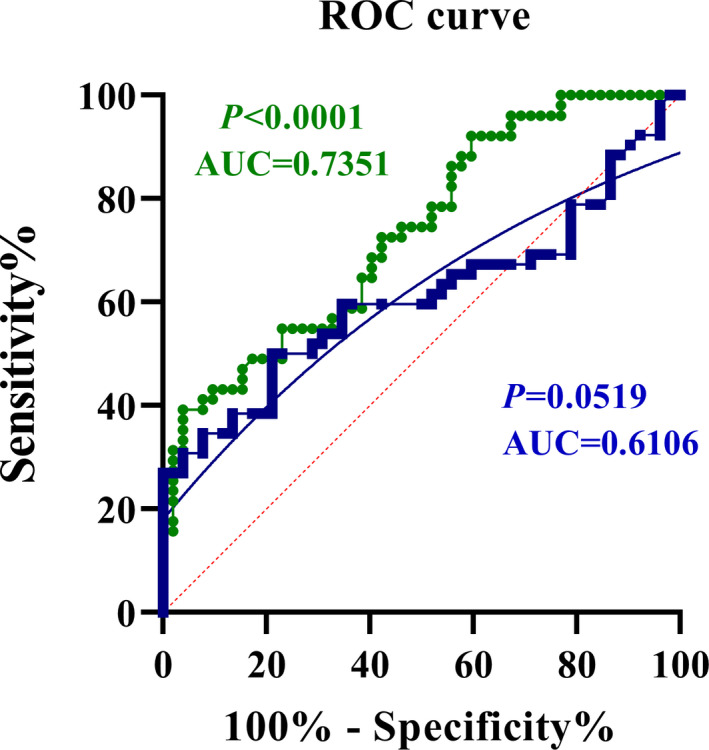
FIGURE 3.

ROC curve analyses; area under the curve (AUC) for miR‐210 (BLUE symbols and connecting lines) was 0.6106 (p = 0.0519). Setting the cut‐off value at 0.1290 gave a sensitivity of 59.62%, specificity of 65.38% and likelihood ratio (LR) of 1.722 (A). AUC for HIF‐1α (GREEN symbols and connecting lines) was 0.7351 (p < 0.0001). The optimum cut‐off value at the level of 0.7995 gave a sensitivity of 64.71%, specificity of 61.54% and likelihood ratio (LR) of 1.682 (B). Logistic regression was also performed to demonstrate the combined ROC curve analysis and predict the performance of miR‐210 + HIF‐1α to diagnose IS, which is shown as a sigmoid GREY curve in the graph. All values were the expression levels at the time of zero (initial referring to the hospital)
