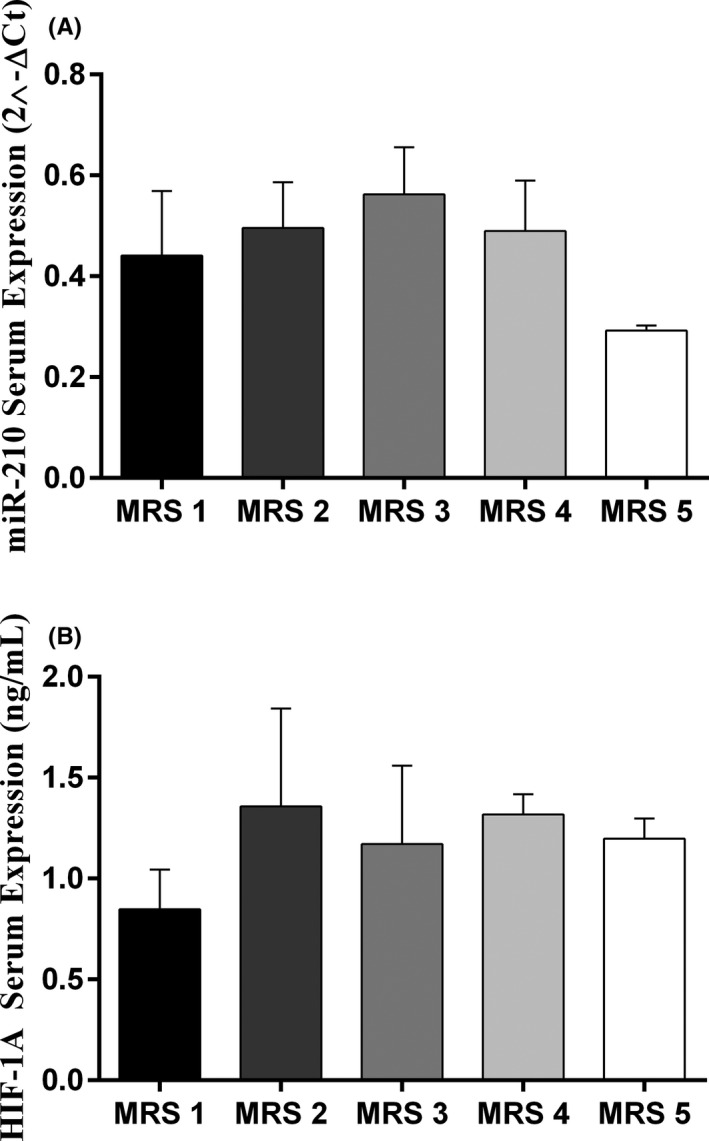
FIGURE 5.

Alterations of HIF‐1α and miR‐210 after 3 months of follow‐up in different categories of mRS; miR‐210 was down‐regulated in IS patients of the MRS 5 category (A), while no remarkable change was observed in the expression of HIF‐1α between 5 groups of MRS (B). IS patients falling in the 6th category of mRS had passed away and no record of HIF‐1α or miR‐602 was available. One‐Way ANOVA and Tukey's post‐test or Kruskal–Wallis and Dunn‐Bonferroni post‐test were used to evaluate the differences between the means of various groups. Bar charts show Mean ± SD for each value. Level of significant p‐values was 0.05
