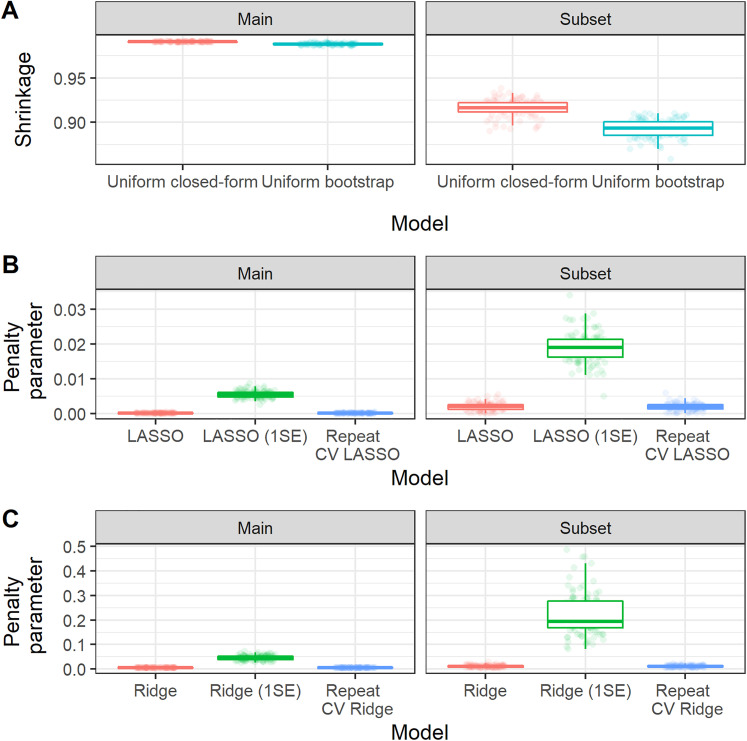
Figure 3.
Boxplot showing the distribution, across bootstrap iterations of the MIMIC-III analysis, of the estimated shrinkage factor or penalisation terms. Random jitter has been applied to each point to aid visual clarity. Main study corresponds to model fitting on the whole MIMIC-III dataset, while subset corresponds to the sub-analysis on the minimum required sample size.

