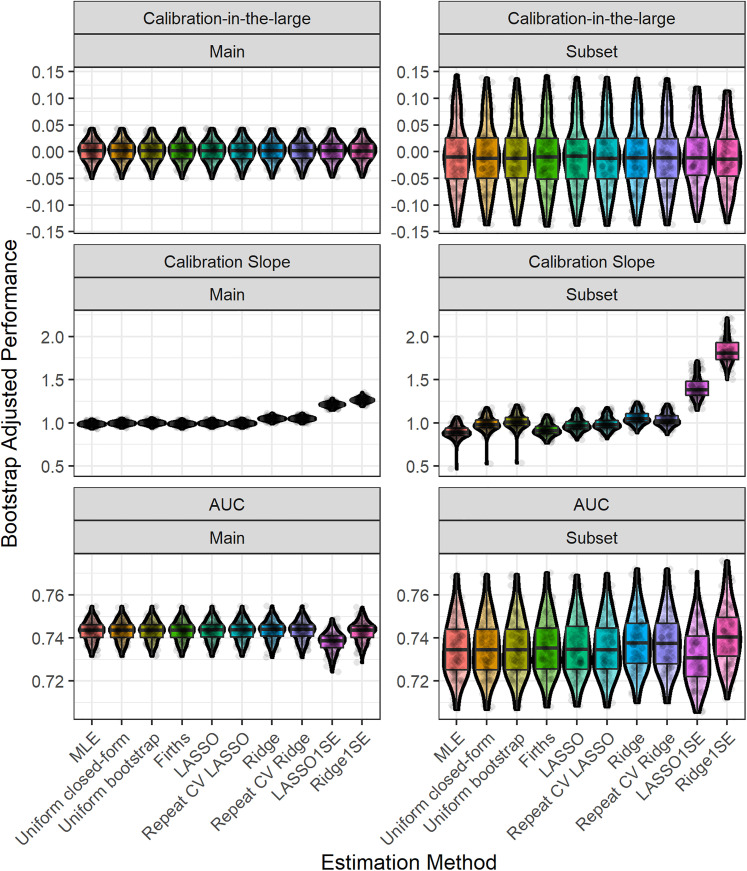
Figure 4.
Boxplot and violin plot showing the distribution, across bootstrap iterations, of the (bootstrap) optimism-adjusted performance results in the MIMIC-III example for each estimation method. Random jitter has been applied to each point to aid visual clarity. Main study corresponds to model fitting on the whole MIMIC-III dataset, while subset corresponds to the sub-analysis on the minimum required sample size.

