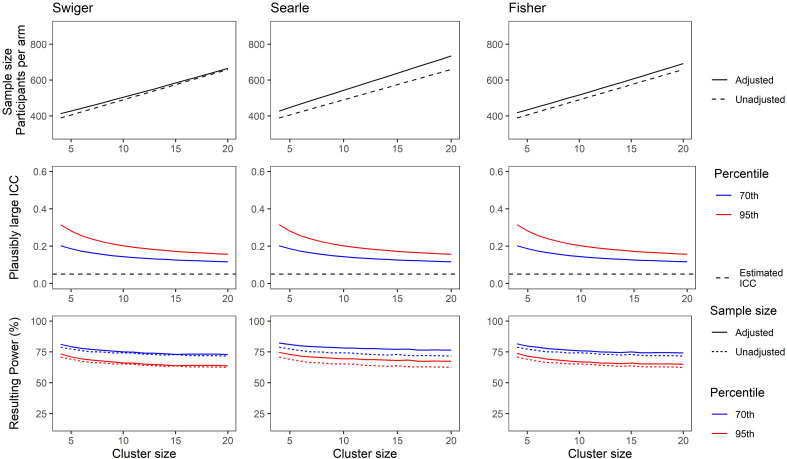
Figure 4.
(Top) Adjusted and unadjusted sample size for a range of cluster sizes based on an estimated intra-cluster correlation (ICC) of 0.05, and a pilot trial of eight clusters per arm, using each method of estimating imprecision in the ICC. (Middle) Plausibly large ICC set at the 70th (blue) and 95th (red) percentile of the ICC CI as calculated using Searle's method. (Bottom) Resulting power for a main trial powered using sample size from top plots and plausibly large ICCs from middle plots. Solid lines show power for a trial using the unadjusted sample size. Dotted lines show power for a trial using the adjusted sample size. Colour as in middle plots.

