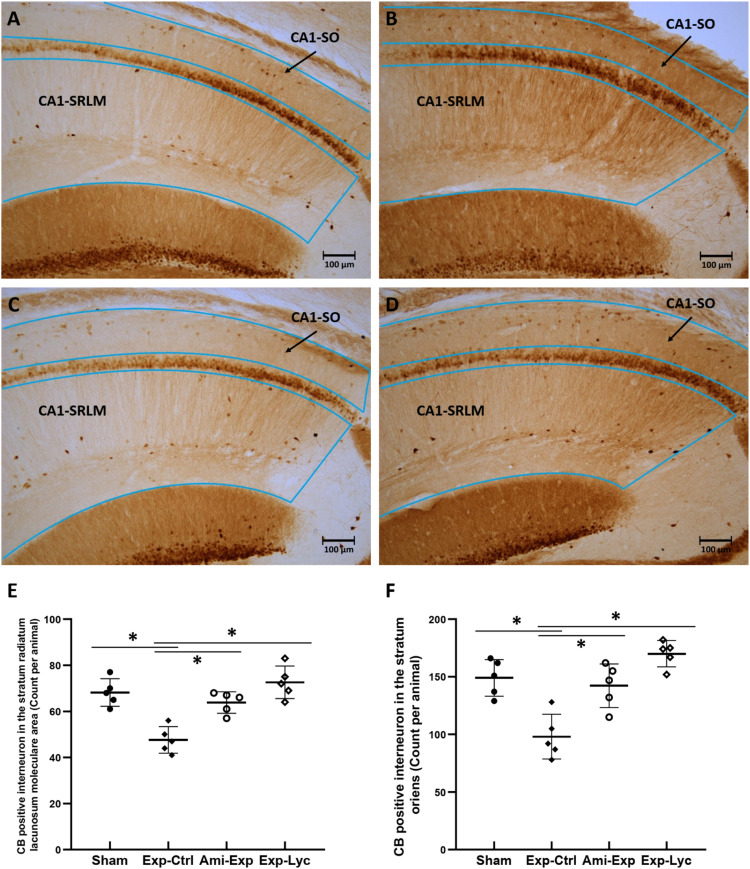
Figure 5.
Calbindin (CB) immunohistochemistry. A, B, C, and D show the CB immunopositive interneurons in the strata radiatum, lacunosum moleculare (SRLM) and oriens (SO) in CA1 areas (the areas indicated in the slice) of the slices from the Sham, Exp-Ctrl, Ami-Exp, and Exp-Lyc groups, respectively. E and F show the numbers of CB immunopositive interneurons in the CA1-SRLM (F (3, 36) = 16.88, P < .0001) and CA1-SO (Panel F, F (3, 36) = 16.47, P < .0001) areas of the Exp-Ctrl group are statistical significantly fewer than the Sham group. Both Ami-Exp and Exp-Lyc groups have more CB immunopositive interneurons in these areas than the Exp-Ctrl group. Asterisks * indicate P < .05 when compared with the Exp-Ctrl group (n=5 in each group, cell number is counted in 5 sagittal brain sections from every 3 alternative sections of the dorsal hippocampus of each mouse, and indicated as the mean ± SD).

