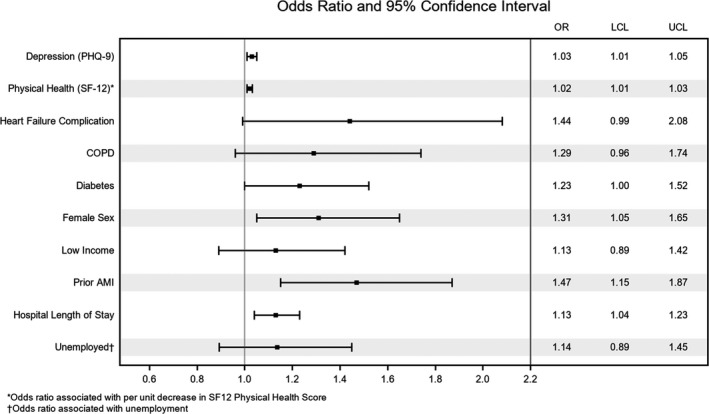
Figure 2. Forest plot showing predictors of 1‐year readmission post AMI (odds ratio for readmitted vs not readmitted).

Note that for the purposes of interpretability we have inverted 2 predictors so they align better in the figure (physical health [SF‐12], unemployment status). AMI indicates acute myocardial infarction; COPD, chronic obstructive pulmonary disease; LCL, lower control limit; OR, odds ratio; PHQ‐9, Patient Health Questionnaire‐9; SF‐12, Short Form‐12; and UCL, upper control limit.
