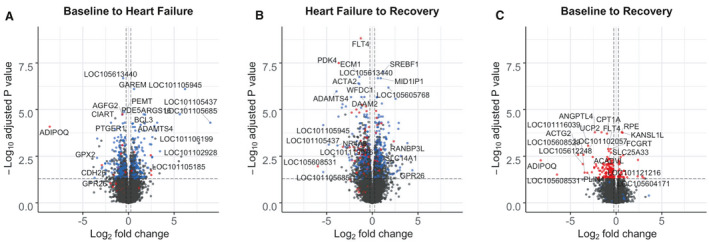
Figure 4. Volcano plots showing genes altered from (A) baseline to heart failure, (B) heart failure to recovery, and (C) baseline to recovery.

Genes to the right of the vertical dashed lines have a >1.2‐fold increase in expression; those to the left of the vertical dashed lines have a >1.2‐fold decrease in expression (ie, <0.83‐fold change) between time points. The horizontal dashed line indicates the threshold for statistical significance (P<0.01 after adjustment for multiple comparisons). Blue dots indicate HF‐responsive genes and red dots indicate HF‐sustained genes. Full gene names available from https://www.ncbi.nlm.nih.gov/gene/.
