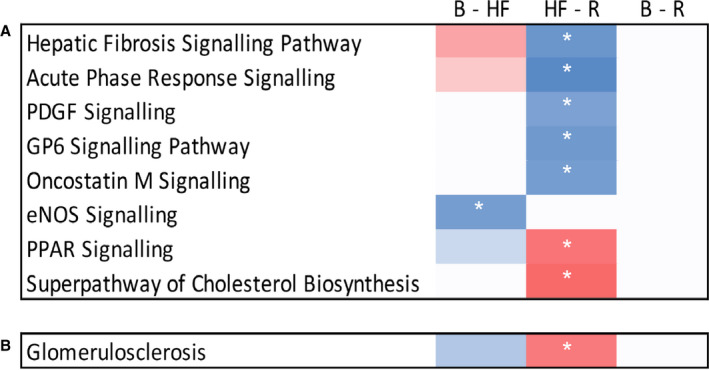
Figure 5. Cell signaling pathways (A) and nephrotoxicity networks significantly enriched during HF and/or recovery (R) (B). (P<0.01 after correction for multiple comparisons.).

Pathways are clustered according to their pattern of activation at each time point. Pathways were considered activated (red boxes) if the activation Z score was >2 or repressed (blue boxes) if the activation Z score was <−2 (indicated by white asterisks). None of these pathways remained altered after recovery. Note that the pathway described as "hepatic" fibrosis likely represents renal fibrosis given that renal gene expression was measured, the Ingenuity Pathway Analysis knowledgebase lacks an annotated pathway for renal fibrosis, and many components of these pathways are shared. B indicates baseline; eNOS, endothelial nitric oxide synthase; GP6, glycoprotein VI; HF, heart failure; PDGF, platelet‐derived growth factor; PPAR, peroxisome proliferator‐activated receptor; and R, recovery.
