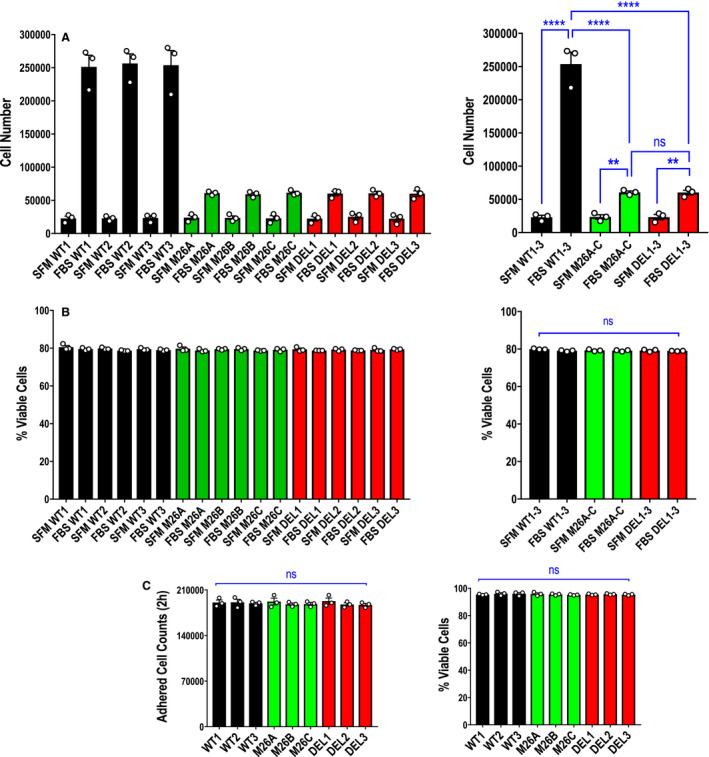
Figure 3. Effect of Ser26 mutation and Egr‐1 deletion on endothelial cell total cell counts.

A, Proliferation assays were performed with CRISPR/Cas9 clones WT1, WT2, WT3, M26A, M26B, M26C, DEL1, DEL2, and DEL3 using the Countess II automated cell counter. Data represent the means of the means of 3 biologically independent experiments±SEM. Left, means of individual experiments. Right, combined means. Significance was assessed by 1‐way ANOVA. **P<0.01; ****P<0.0001. B, Viability of WT1, M26A, and DEL1 cells (from A) was determined after 72 hours when cell counts were quantified using the Countess II automatic cell counter with Trypan blue exclusion. Data represent the means of the means of 3 biologically independent experiments±SEM. Left, means of individual experiments. Right, combined means. Significance was assessed by Kruskal‐Wallis test. C, Assessment of adherent cell counts (left) and viability (Trypan blue exclusion; right) of 3 clones per cell type 2 hours after 2×10⁵ cells were seeded per well using the Countess II automatic cell counter. Data represent the means of the means of 3 biologically independent experiments±SEM. Significance was assessed by Kruskal‐Wallis test or 1‐way ANOVA. SFM denotes serum free medium; FBS denotes medium containing fetal bovine serum. DEL indicates deletion; Egr‐1, early growth response‐1; M, mutant; ns, not significant; and WT, wild‐type.
