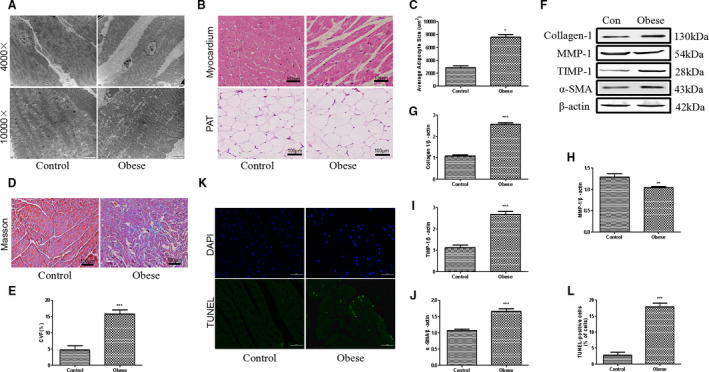
Figure 2. The myocardial structure was disordered and cardiac apoptosis was increased in obese rats.

A, Representative images of electron microscope of myocardium of control (Con) and obese rats. Images were enlarged by 4000 and 10,000 times. B, Hematoxylin‐eosin staining of heart cryosections and pericardial adipose tissue (PAT) of rats; bar=100 µm. C, Average adipocyte size of PAT from control and obese rats. D, Masson staining of myocardium from control and obese rats. E, Collagen volume fraction (CVF) of myocardium from 2 experimental groups. F through J, Western blot analysis of cardiac collagen 1, matrix metalloproteinase‐1 (MMP‐1), tissue inhibitor of metalloproteinase‐1 (TIMP‐1), and α‐smooth muscle actin (α‐SMA) protein expressions of control and obese rats. K, Representative images of heart sections following TdT‐mediated dUTP nick end labeling (TUNEL) staining. Blue indicates the nucleus by 4′,6‐diamidino‐2‐phenylindole (DAPI) staining. Bar=50 µm. L, Statistical analysis of TUNEL‐positive cardiomyocytes in 2 groups of rats. Mann‐Whitney U test was used for C, E, and L; t‐test was used for G‐J. Data are presented as mean±SEM. For C, E, and L, n=5/group; for G through J, n=3/group. *P<0.05 vs control, **P<0.01 vs control, and ***P<0.001 vs control.
