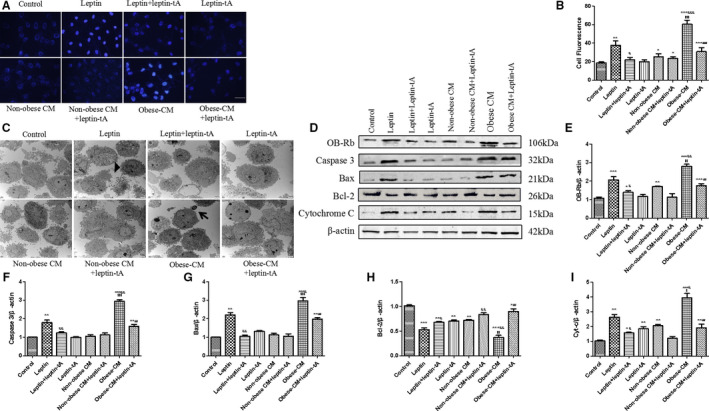
Figure 4. Obese rat pericardial adipose tissue–derived leptin induces H9c2 cell apoptosis.

A, Representative images of cell apoptosis by Hoechst 33342 staining; bar=50 µm. B, Statistical analysis of relative fluorescence intensity of apoptosis. C, Transmission electron microscope was used to observe ultrastructure of cells under different treatments at 4000 times of magnification. Apoptotic cells shrink in size, cytoplasm condenses, chromatin aggregates (black triangle), and some form apoptotic bodies (black arrow). D through I, Western blot analysis of leptin receptor (OB‐Rb), caspase 3, Bax, cytochrome c (Cyt‐c), and Bcl‐2 protein expressions in experimental groups. Kruskal‐Wallis test was used for B; and 1‐way ANOVA with Bonferroni correction was used for E through I. Data are presented as mean±SEM. For B, n=5/group; for E through I, n=3/group. CM indicates conditioned medium. * P<0.05 vs control, ** P<0.01 vs control, *** P<0.001 vs control, & P<0.05 vs leptin, && P<0.01 vs leptin, &&& P<0.001 vs leptin, $$$ P<0.001 vs nonobese CM, and ### P<0.001 vs obese CM.
