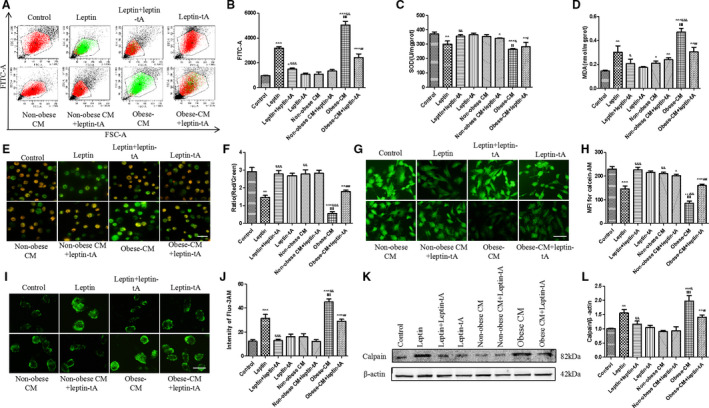
Figure 5. Pericardial adipose tissue–derived leptin of obese rats promotes oxidative stress and mitochondrial dysfunction of H9c2 cells.

A and B, Representative scatter diagram and analysis of reactive oxygen species (ROS) production by flow cytometry. Cells were incubated for 20 minutes with free fetal bovine serum containing 10 µmol/L DCFH‐DA to label intracellular ROS, as stated before. C, Effects of PAT‐derived leptin on superoxide dismutase (SOD) generation of H9c2 cells. D, Effects of PAT‐derived leptin on malondialdehyde (MDA) generation of H9c2 cells. E and F, Representative images of JC‐1 staining on mitochondrial membrane potential. The red dye represents normal potential, whereas the green is considered as decreased mitochondrial membrane potential; bar=50 µm. G and H, Degrees of mitochondrial permeability transition pore opening by calcein‐AM staining; bar=50 µm. I and J, Fluo3‐AM staining of Ca2+ concentration of experimental groups; bar=50 µm. K and L, Western blot analysis on calpain protein expression in 8 experimental groups. Kruskal‐Wallis test was used for B, F, H, and J; and 1‐way ANOVA with Bonferroni correction was used for C, D, and L. Data are presented as mean±SEM. For B, F, H, and J, n=5/group; for C, D, and L, n=3/group. CM indicates conditioned medium; FSC, forward scatter; and MFI, mean fluorescence intensity. *P<0.05 vs control, **P<0.01 vs control, ***P<0.001 vs control, & P<0.05 vs leptin, && P<0.01 vs leptin, &&& P<0.001 vs leptin, $$ P<0.01 vs nonobese CM, $$$ P<0.001 vs nonobese CM, # P<0.05 vs obese CM, ## P<0.01 vs obese CM, and ### P<0.001 vs obese CM.
