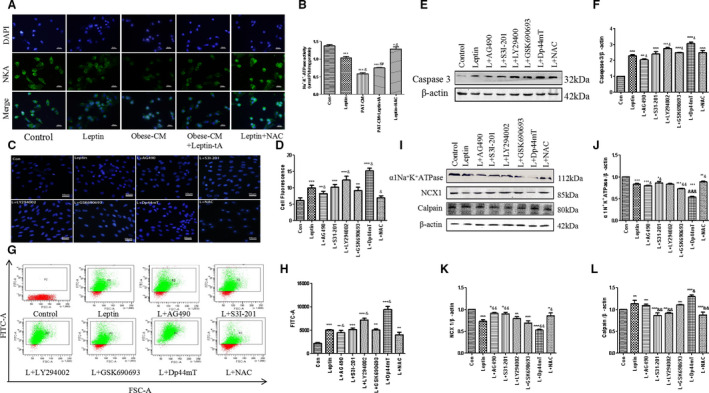
Figure 6. Janus kinase 2 (JAK2)/signal transducer and activator of transcription 3 (STAT3) and phosphoinositide 3‐kinase (PI3K)/protein kinase B (Akt) signaling pathways are involved in the leptin‐mediated H9c2 cell apoptosis.

Leptin was added for another 48 hours after 60 minutes of pretreatment of cells with reactive oxygen species (ROS) scavenger n‐acetyl‐amino acid (NAC); moreover, JAK2 inhibitor AG490, STAT3 inhibitor S3I‐201, PI3K inhibitor LY294002, Akt inhibitor GSK690693, and ROS inducer 2‐(di‐2‐pyridinylmethylene)‐N,N‐dimethyl‐hydrazinecarbothioamide (Dp44mT) were preincubated as well. A and B, Na+/K+‐ATPase (NKA) expression assay in cells by immunofluorescence staining. The nuclei were stained by 4′,6‐diamidino‐2‐phenylindole (DAPI) (blue); bar=50 µm. C and D, Hoechst 33342 fluorescence staining in each group. Intensity was calculated using the Image J program; bar=50 µm. E and F, Western blot analysis of caspase 3 protein expression in 8 groups. G and H, Detection of ROS production in 8 groups. I through L, Western blot analysis of NKA, sodium‐calcium exchanger 1 (NCX1), and calpain protein expressions in 8 groups. Kruskal‐Wallis test was used for B, D, and H; and 1‐way ANOVA with Bonferroni correction was used for F and J through L. Data are presented as mean±SEM. For B, D, and H, n=5/group; for F and J through L, n=3/group. CM indicates conditioned medium; Con, control; and PAT, pericardial adipose tissue. *P<0.05 vs control, **P<0.01 vs control, ***P<0.001 vs control, & P<0.05 vs leptin, && P<0.01 vs leptin, and &&& P<0.001 vs leptin.
