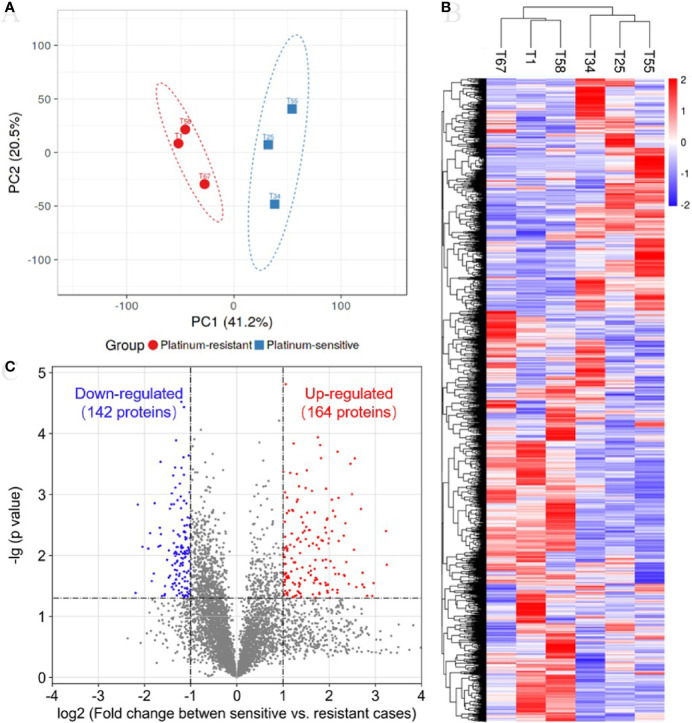
Figure 1.
Proteomic analysis reveals a difference protein expression profiling between platinum-sensitive and platinum-resistant tumors. (A) Visualization of the first two principal components (PCs) from principal component analysis (PCA) separating samples based on the Z-score normalized quantification for identified proteins. The tissues from platinum-sensitive (blue square) and platinum-resistant (red circle) patients are labelled with different shapes and colors, and a 95% confidence ellipse for each group of samples was drawn. (B) Hierarchical clustering and heatmap of Z-score normalized expression values of all identified proteins in platinum-sensitive and platinum-resistant tumors. Red, high abundance; and blue, low abundance. (C) Volcano plot for the comparison between the platinum-sensitive and platinum-resistant tumors. The cutoff values of fold change ≥2 and p-value < 0.05 were utilized to identify differentially expressed proteins. Non-changed proteins are shown as gray dots, upregulated proteins as red dots, and downregulated proteins as blue dots.

