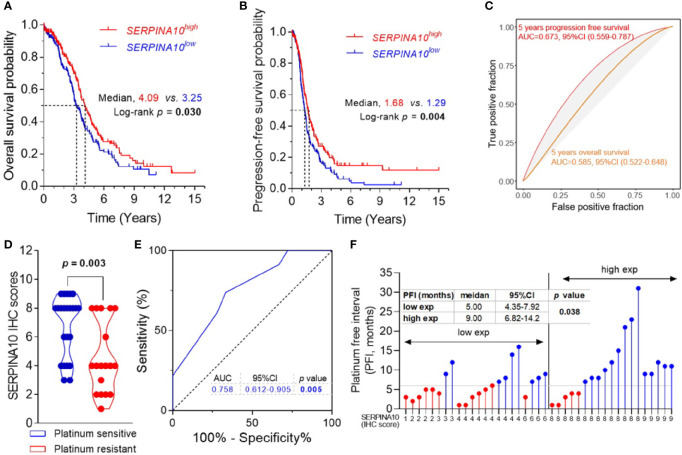
Figure 4.
Prognostic and predictive value of SERPINA10 expression for platinum sensitivity and survival of high-grade serous ovarian cancer (HGSOC) patients. (A, B) Kaplan–Meier analysis of overall survival (OS) and progression-free survival (PFS) for The Cancer Genome Atlas (TCGA) ovarian cancer cohort, stratified by median value of SERPINA10 mRNA expressions. Medians of survival (OS and PFS) and log-rank p-Values were indicated, respectively. (C) Time-dependent receiver operating characteristic (ROC) curves of SERPINA10 expression for the predictions of 5-year OS and PFS. Expression data of RNA-sequencing and survival data of ovarian cancer were acquired from TCGA dataset. (D) Immunohistochemical staining of SERPINA10 expression in HGSOC patients. p-Values were calculated by Mann–Whitney test. (E) ROC curves of SERPINA10 expression in predicting platinum-sensitivity status of HGSOC patients who were receiving platinum-based chemotherapy treatment after cytoreductive surgery. The AUC was the highest for the SERPINA10 expression (AUC = 0.758; 95% CI = 0.612–0.905; p = 0.005). (F) Correlation analysis of SERPINA10 expression and platinum-free interval (PFI) in HGSOC patients. Grouping of HGSOC patients according to their immunoreactive scores (cutoff = 6) into low exp (n = 22) or high exp (n = 19). p-Value was calculated by Mann–Whitney test. AUC, area under the curve.

