Figure 5.
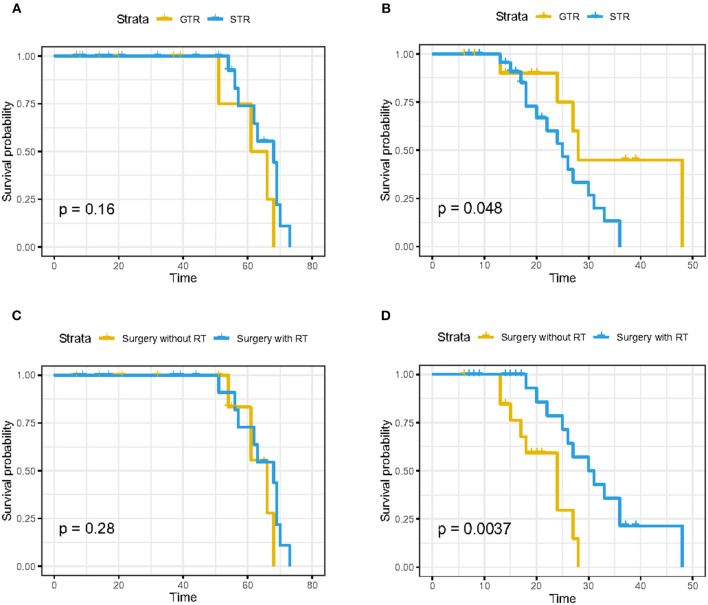
Kaplan–Meier curves of OS in patients from Xiangya Hospital stratified by (A) gross total resection (GTR) and subtotal resection (STR), (C) surgery with radiotherapy and surgery without radiotherapy; K–M curves of progression-free survival in patients from Xiangya Hospital stratified by (B) GTR and STR and (D) surgery with radiotherapy and surgery without radiotherapy.

