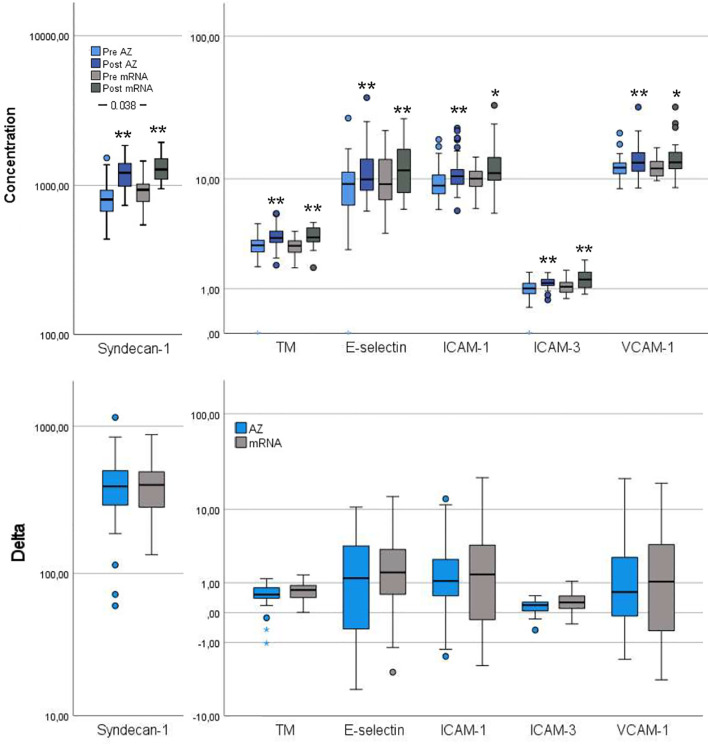
Figure 3.
Vascular endothelial activation markers pre- and post-vaccination and delta changes with either AZ (n=55) or mRNA (n=25) vaccines. Levels of Syndecan-1 (pg/ml), thrombomodulin (TM, ng/ml), endothelial (E)-selectin (ng/ml), intercellular adhesion molecule (ICAM)-1 (µg/ml), ICAM-3 (ng/ml) and vascular cell adhesion molecule (VCAM)-1 (µg/ml) are displayed on log scales. The top figure displays pre- and post-vaccination values, and the bottom figure displays delta changes. The box plots display median, first and third quartile (box mid-line, button and top, respectively) and the whiskers display maximum and minimum values with outliers (circles) and extremes (small asterisks) displayed. AZ vaccinated individuals are displayed by blue bars (top figure: pre=light blue, post=dark blue) and mRNA vaccinated individuals are displayed by gray bars (top figure: pre=light gray, post=dark gray). Differences between AZ and mRNA vaccinated individuals either pre- and post-vaccination and delta changes are investigated by Mann-Whitney U test, with p-values displayed. Changes over time within the AZ or mRNA groups are investigated by Wilcoxon signed-rank test, with **p < 0.0001 and *p < 0.010 (displayed over the post-vaccination bars).

