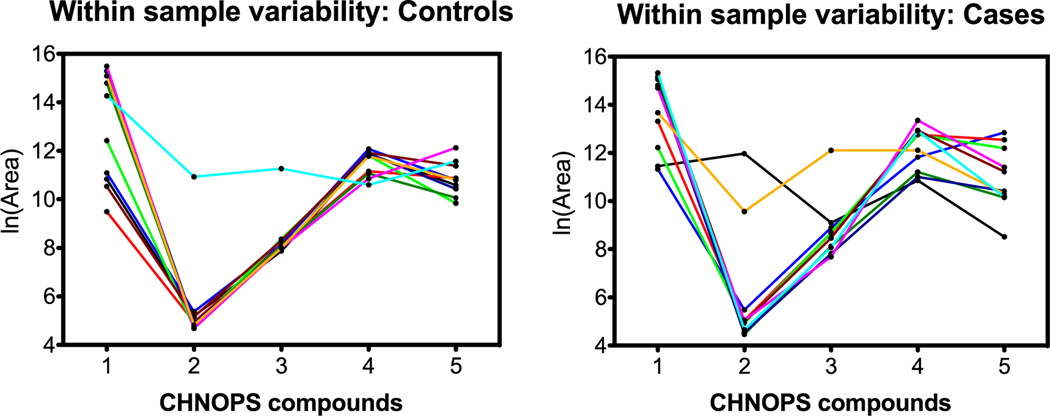
Figure 10.
C, H, N, O, P, S compound group comparison of controls and cases. The x-axis identifies the five C, H, N, O, P, S compounds in order from table 1; lines connect individual samples. In contrast to previous examples, with the exception of one sample in the controls panel (left), the controls show more consistent patterns across compounds than the cases, especially for compounds 4 and 5.

