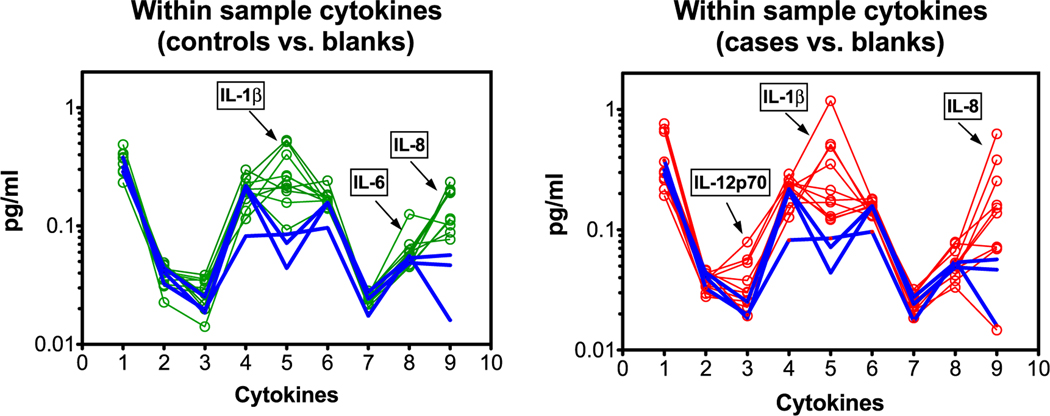
Figure 2.
Comparisons of cytokines (x-axis) and within-sample pattern variability (y-axis) with respect to blanks; each individual sample is connected with lines. Cytokines are numbered in order listed above. The left panel shows the comparison of controls (green) versus blanks (blue) and the right panel shows cases (red) versus blanks (blue). IL-1β, IL-6, and IL-8 appear higher than blanks for controls; IL-12p70, IL-1β, and IL-8 appear higher than blanks for cases.

