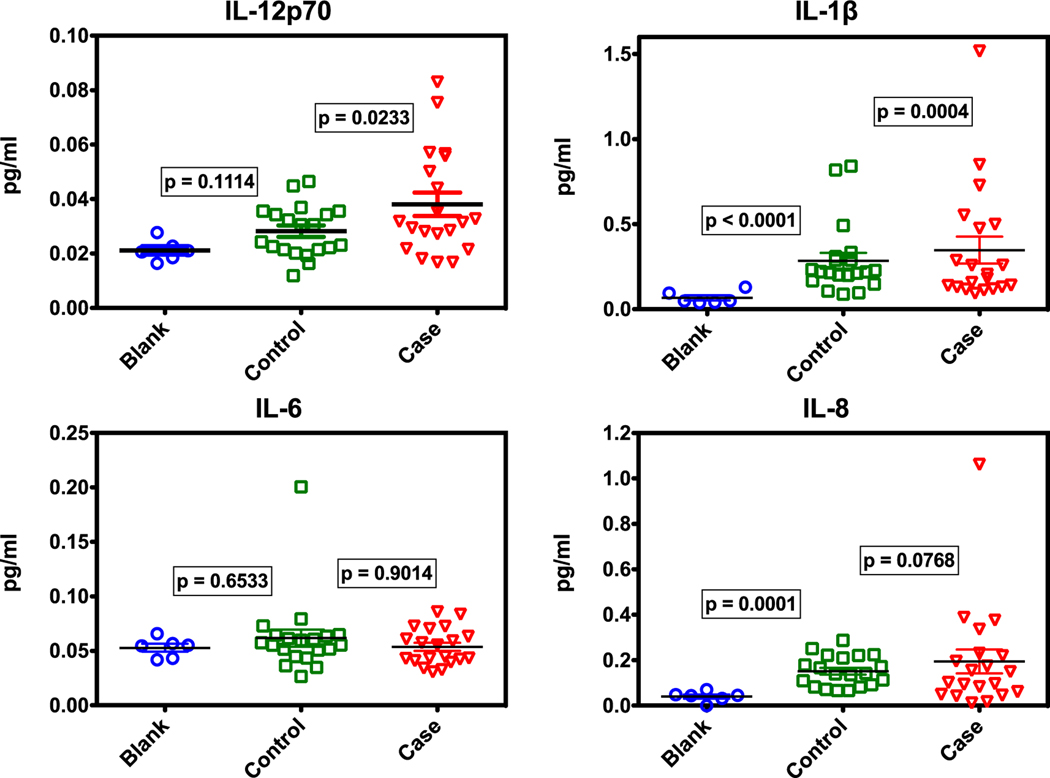
Figure 3.
Comparison of select cytokines (those listed in figure 2) across sample groups. P-values are from t-tests of natural log-transformed (loge) concentrations of sample versus blanks. Statistically, IL-12p70 cases, IL-1β controls and cases, and IL-8 controls are all different from blanks (p < 0.05), indicating that human cytokines in breath are collected on masks.

