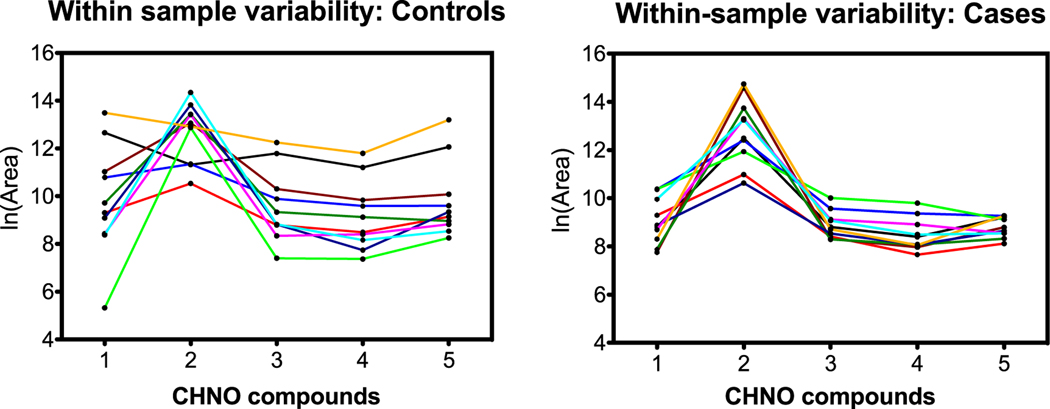
Figure 9.
C, H, N, O compound group comparison of controls and cases. The x-axis identifies the five C, H, N, O compounds in order from table 1; lines connect individual samples. Graphs show more consistent patterns across compounds for cases than for controls.

