
FIG 1.
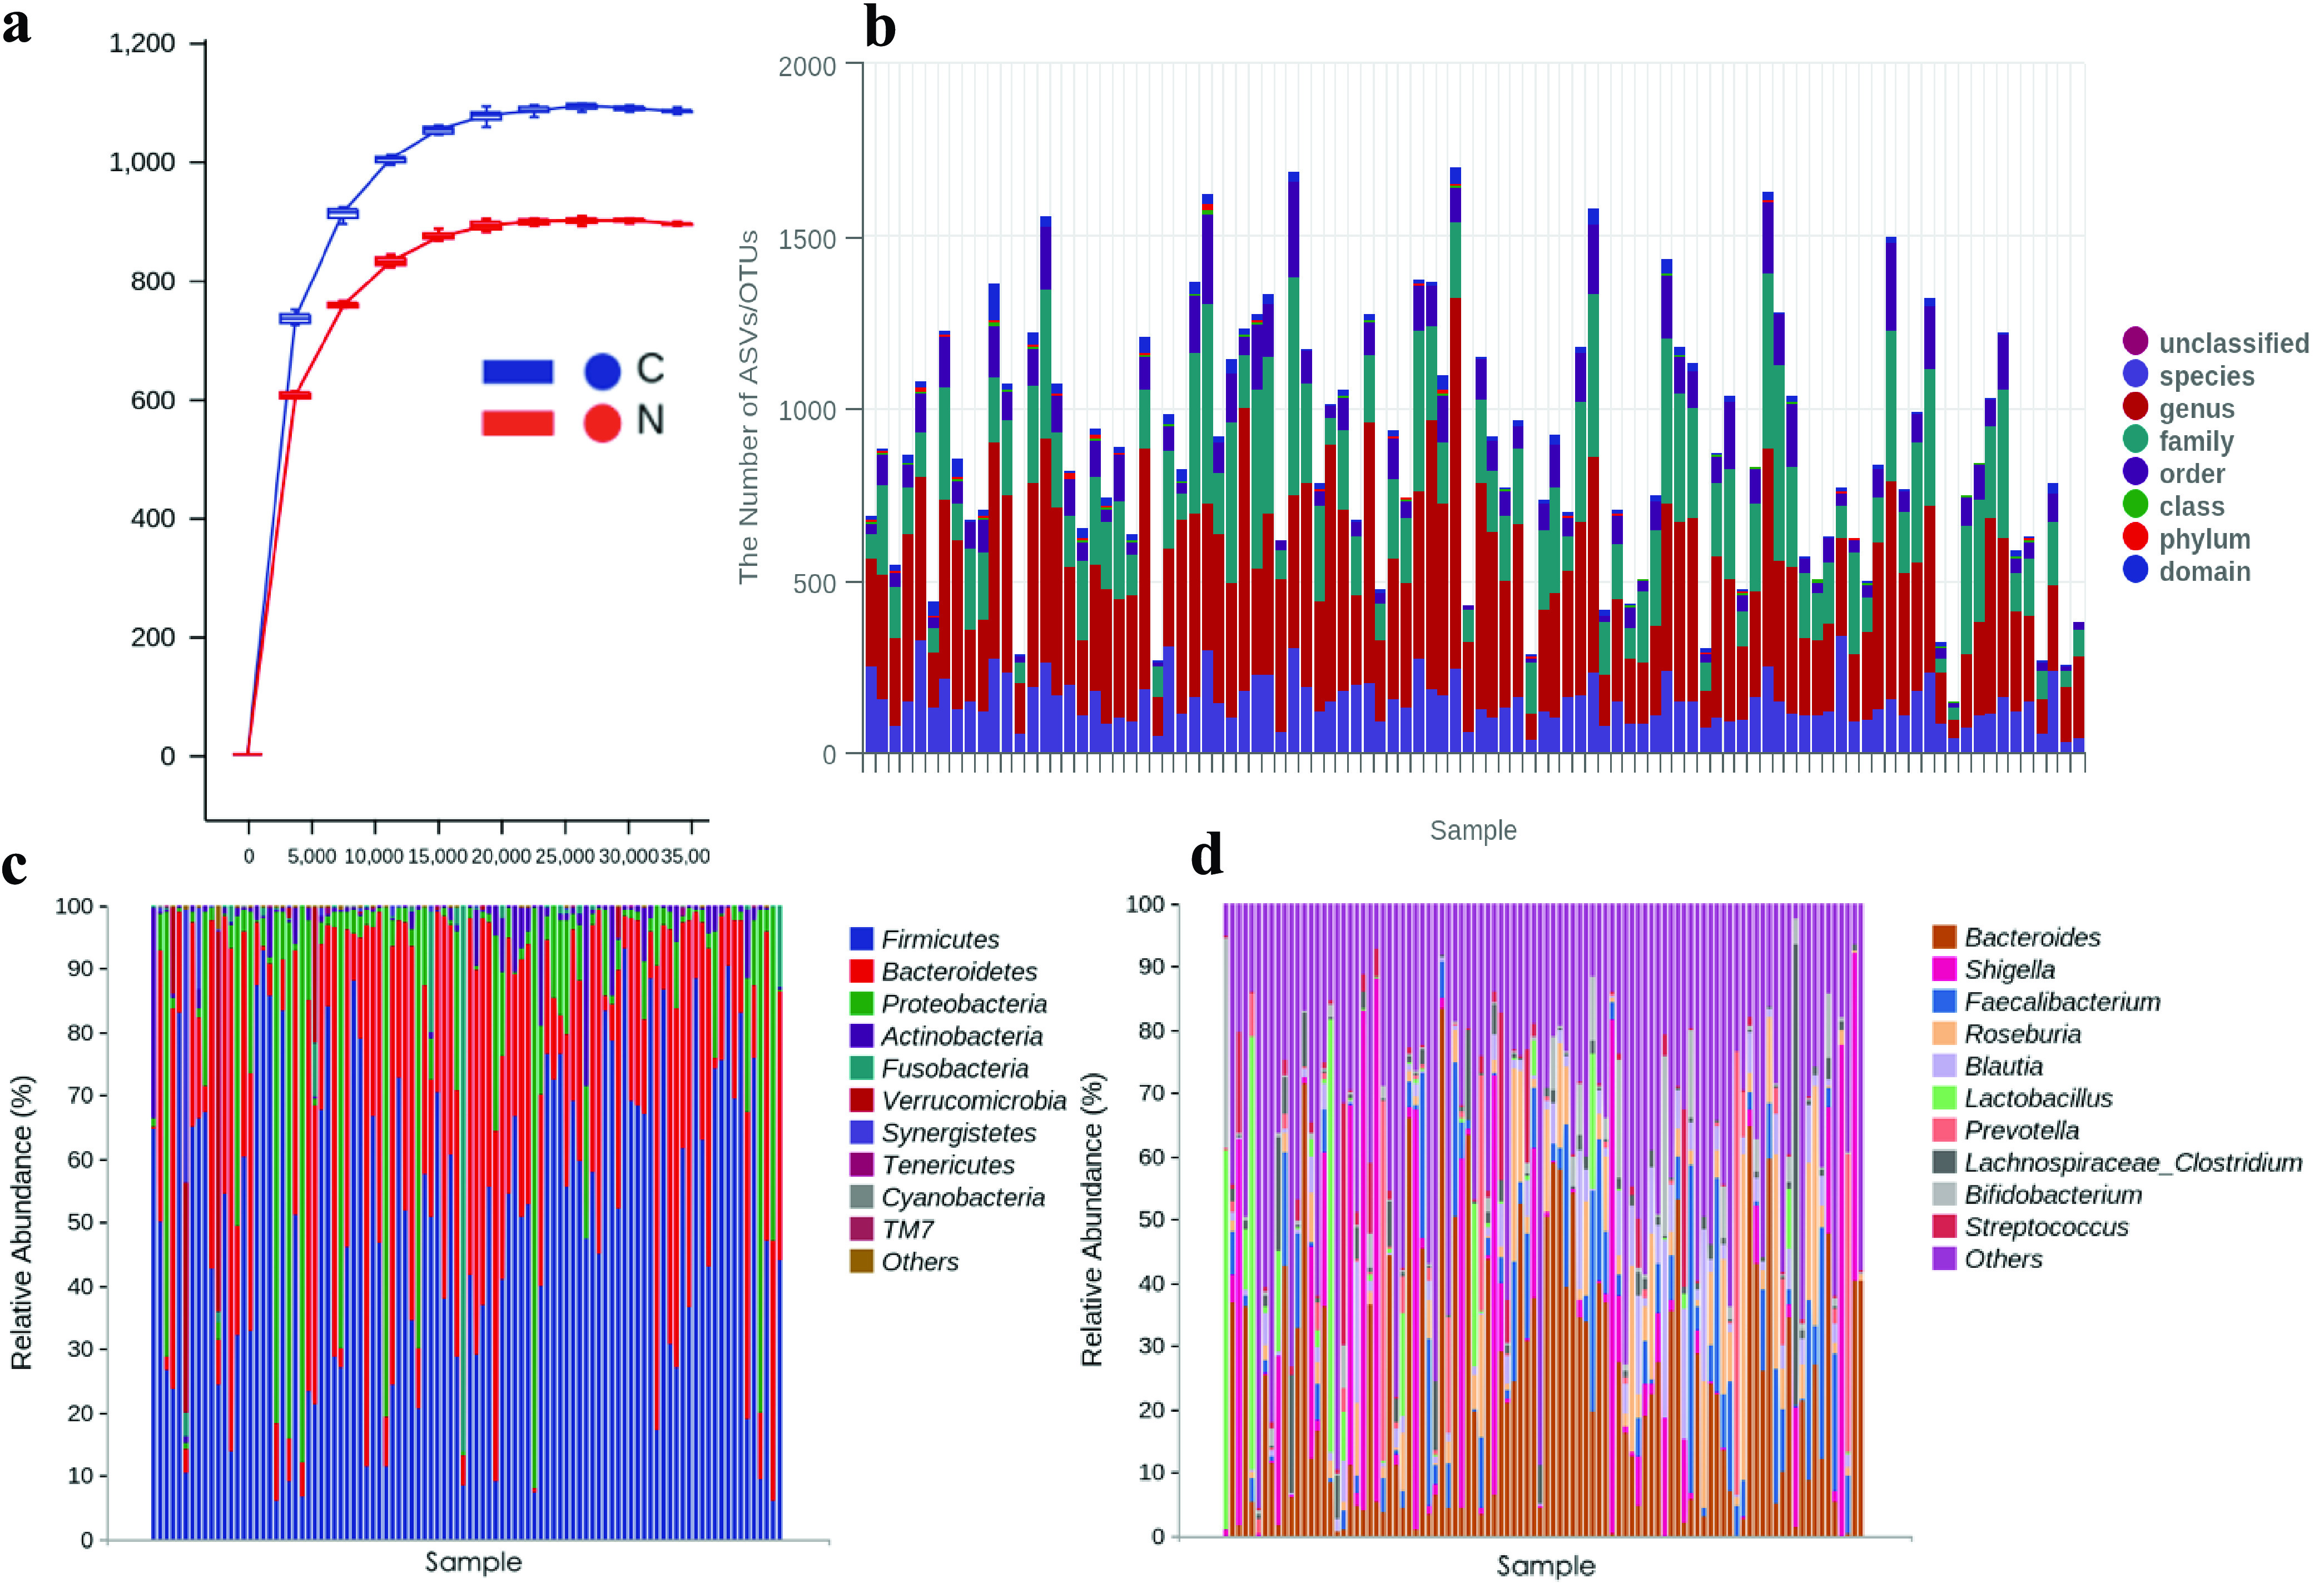
Species compositions and microbial diversity analyses of the C and N groups. (a) Rarefaction curve. (b) Species taxonomy in each sample. (c and d) Microbial composition at the phylum level (c) and the genus level (d). Note that the groups in the abscissa are displayed in the order C1 to C49 and N1 to N49.