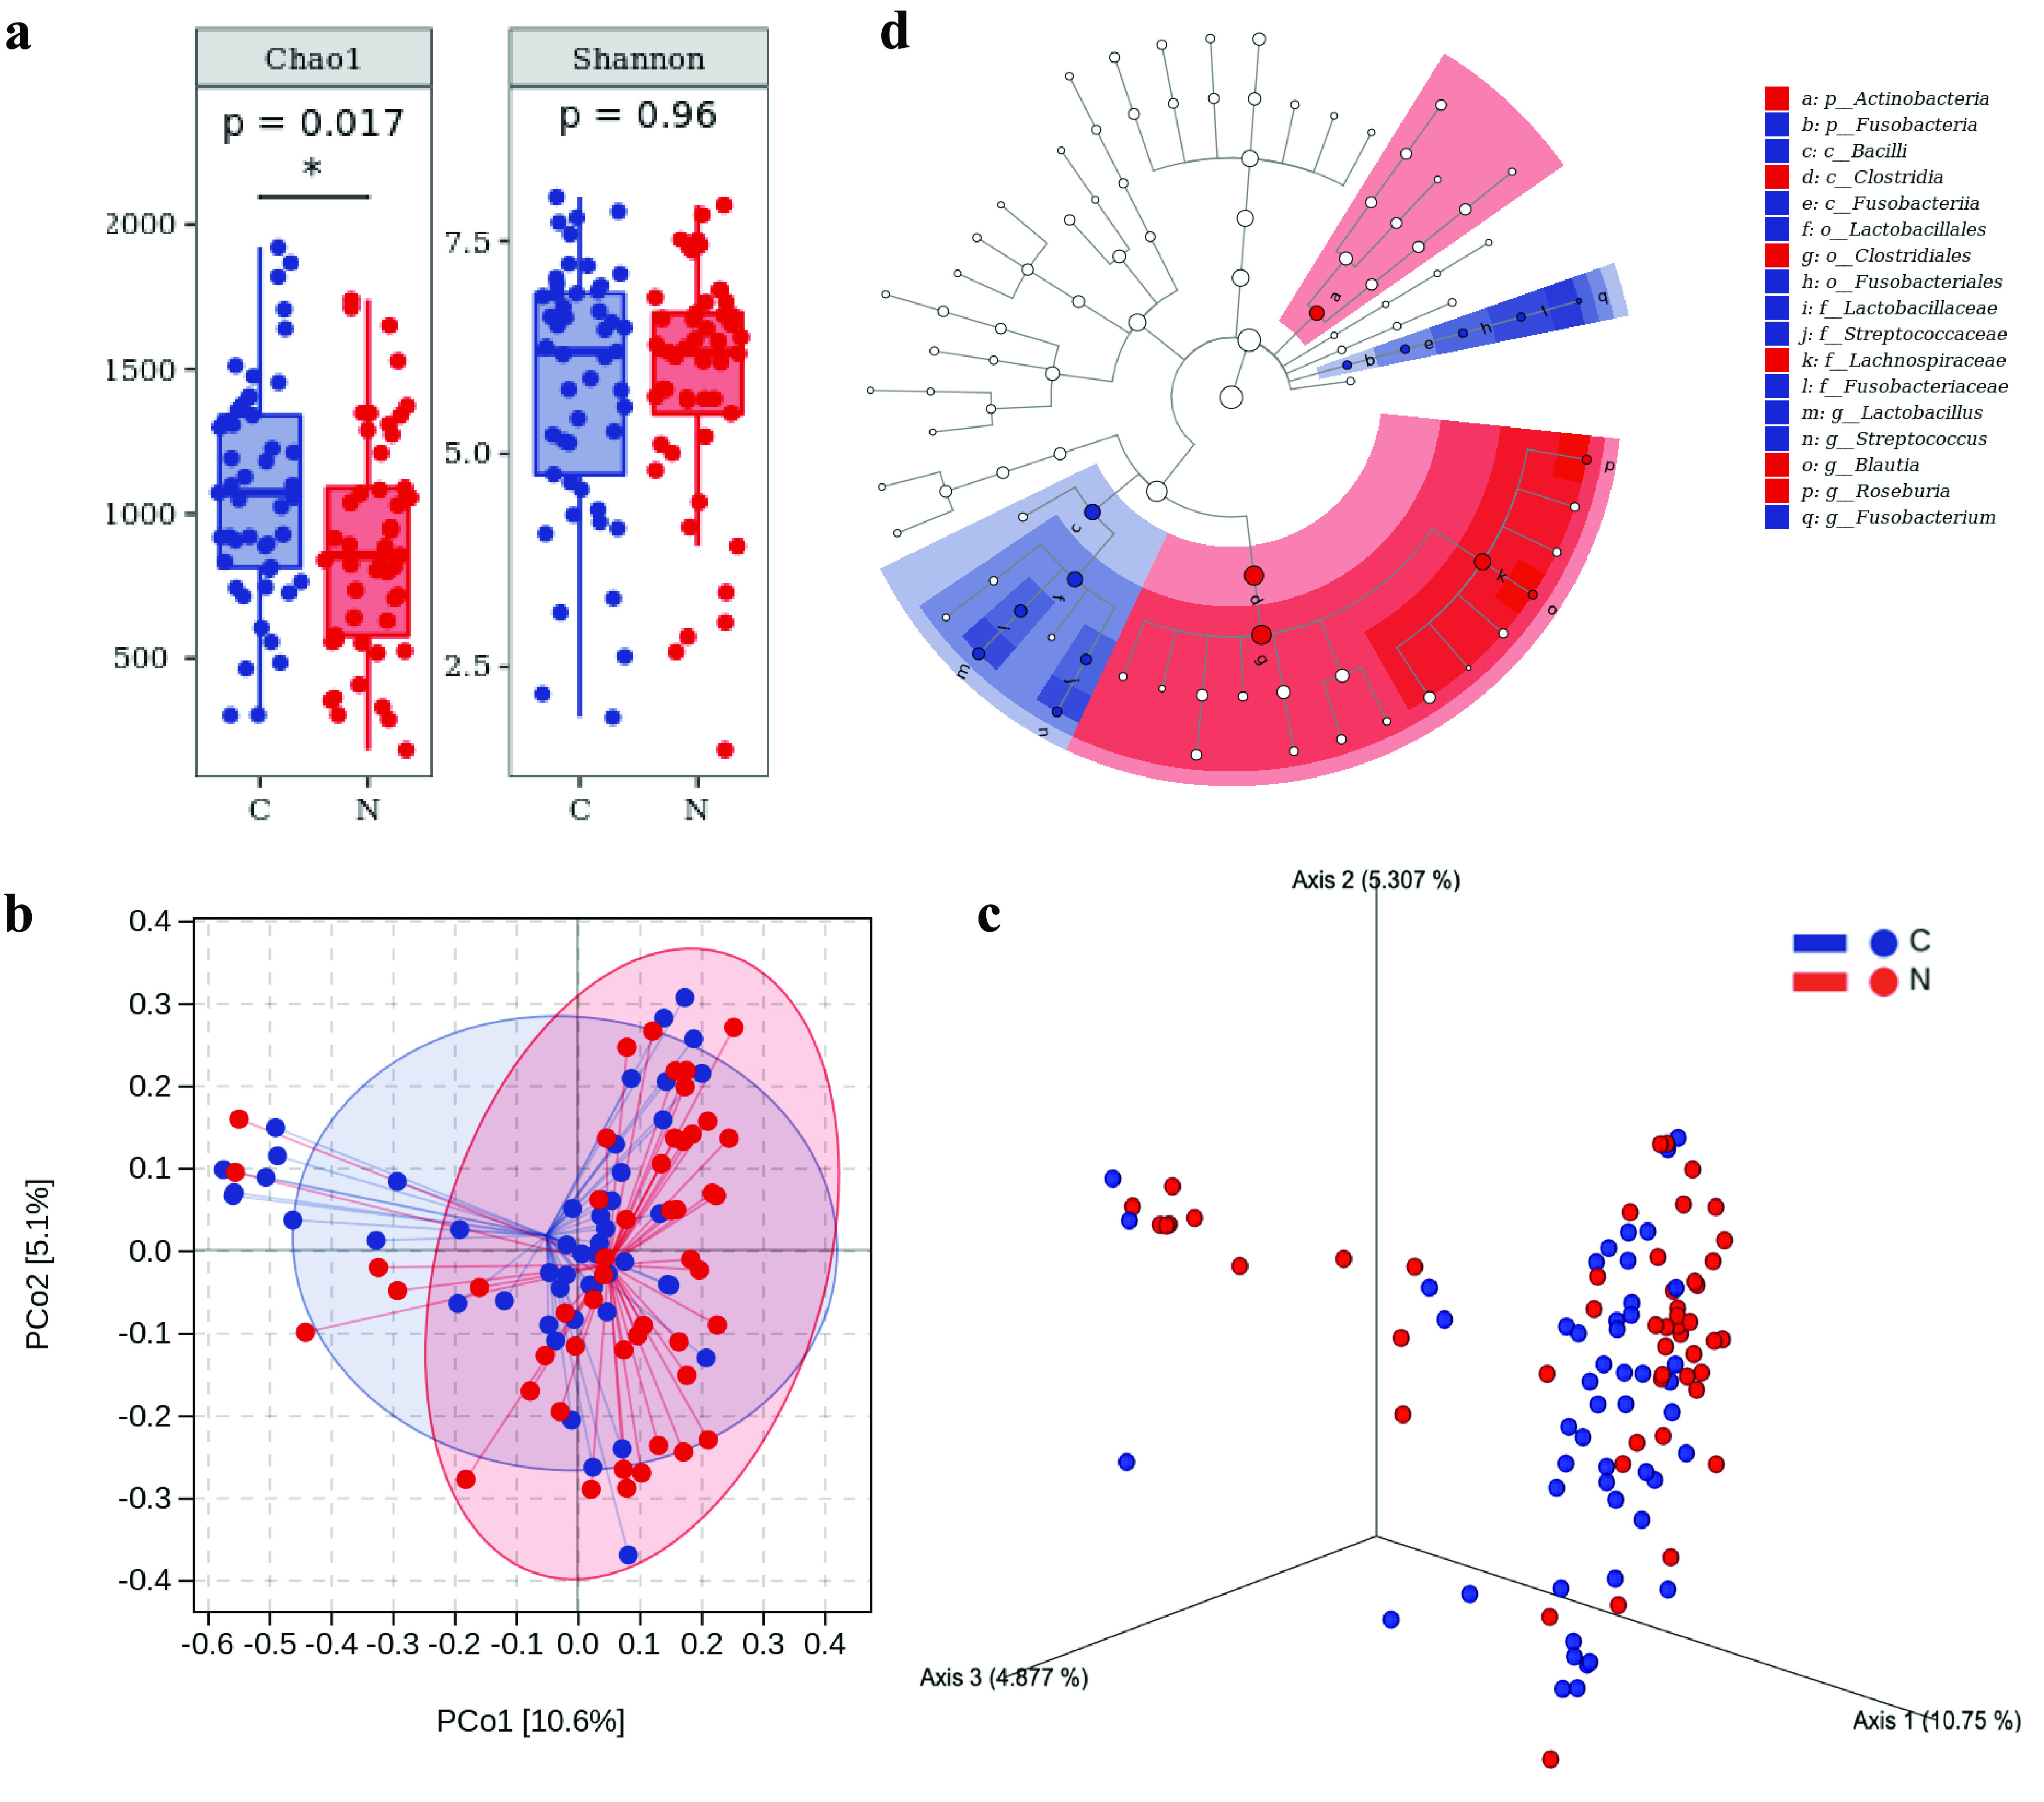
FIG 2.

Microbial diversity and LEfSe analyses of the C and N groups. (a) Alpha diversity measurements by species richness and gene counts. (b and c) Beta diversity measurements by PCoA (b) and 3D-PCoA (c). (d) Taxonomic branch diagram of significant microbial species (LDA threshold of 4).
