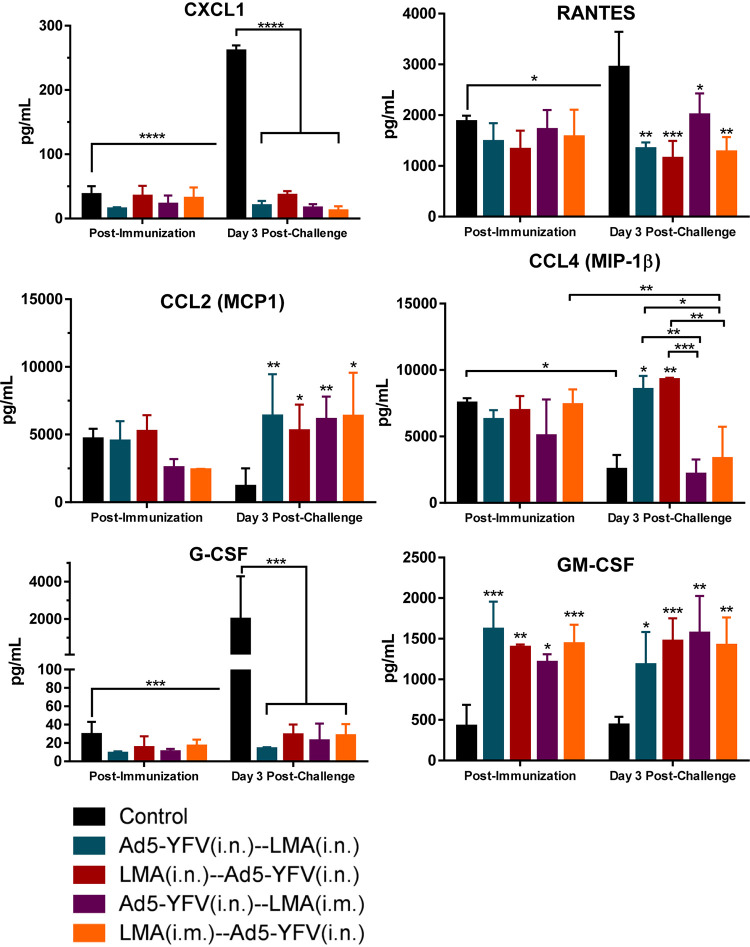
FIG 11.
Splenocyte chemokine responses during long-term heterologous prime-boost vaccination study. Chemokine analysis was performed as described for Fig. 9. Chemokine responses are shown. Statistical significance was determined using two-way ANOVA with Tukey’s post hoc test to compare multiple time points or Student's t test to compare 2 groups within the same time point. Asterisks above columns represented comparison to the control group, while horizontal bars represented differences between test groups. *, P < 0.05; **, P < 0.01; ***, P < 0.001; ****, P < 0.0001. Two biological replicates were performed and data plotted. In vitro studies had 3 replicates.

