
FIG 3.
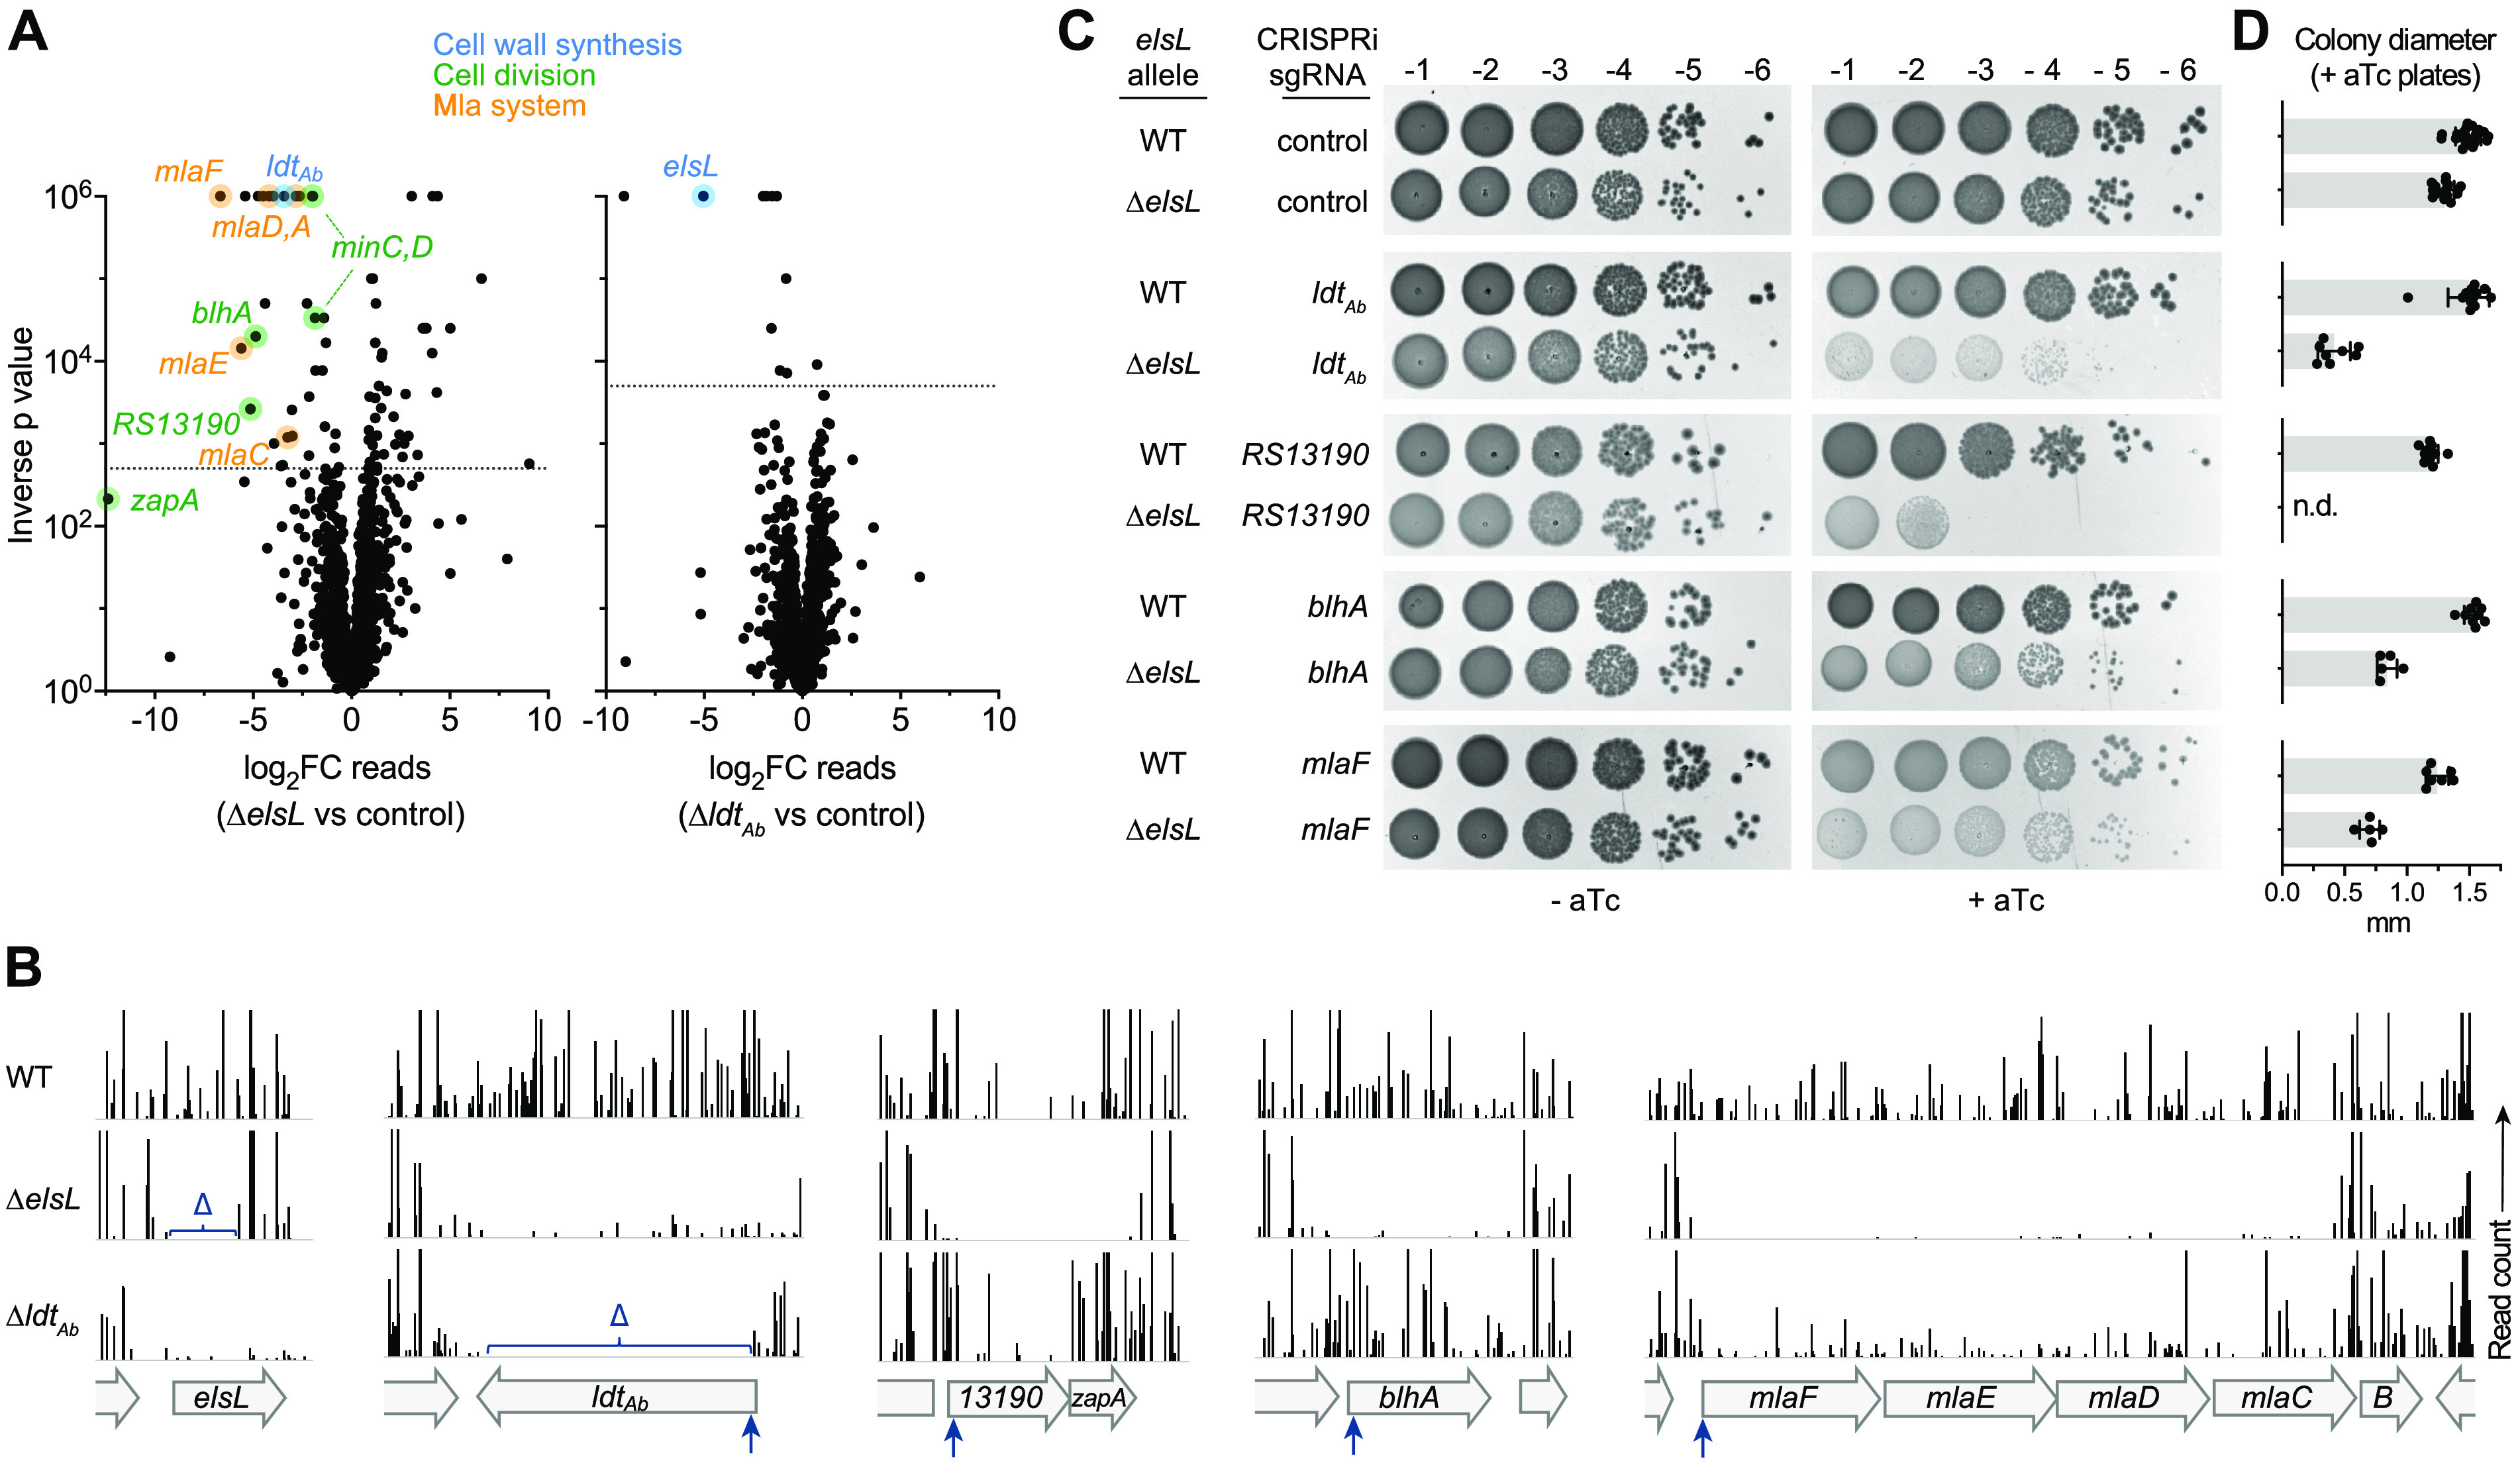
Tn-seq reveals aggravating genetic interactions with elsL and ldtAb. (A) Tn-seq genetic interaction analysis. Volcano plot shows the ratio of Tn-seq read counts mapped to genes in the mutant mariner transposon library (ΔelsL or ΔldtAb) compared to the control transposon library (WT). Dotted horizontal lines indicate a false-discovery rate (q value) of 0.05. Hits described in the text are color-highlighted according to the indicated pathway. (B) Tracks show Tn-seq read counts at each insertion site at different chromosomal loci within the indicated mariner library. Bars represent the normalized read count, and vertical arrows indicate the position targeted by CRISPRi. Δ indicates a deleted region. (C) Validation of aggravating genetic interactions with ΔelsL via targeted CRISPRi and colony formation tests. WT or ΔelsL strains harboring aTc-inducible dcas9 and the indicated sgRNA were serially diluted (10-fold) and spotted on LB agar medium supplemented with 0 or 50 ng/mL aTc. Colonies resulting after overnight 37°C incubation were imaged. (D) Diameters of colonies from triplicate aTc plates at 10−6 or higher dilution were measured by image analysis. Bars show the mean ± SD (n ≥ 5 colonies). P < 0.0001 in unpaired t tests comparing ΔelsL to WT with each sgRNA. n.d., colonies not detected and statistical test not performed.