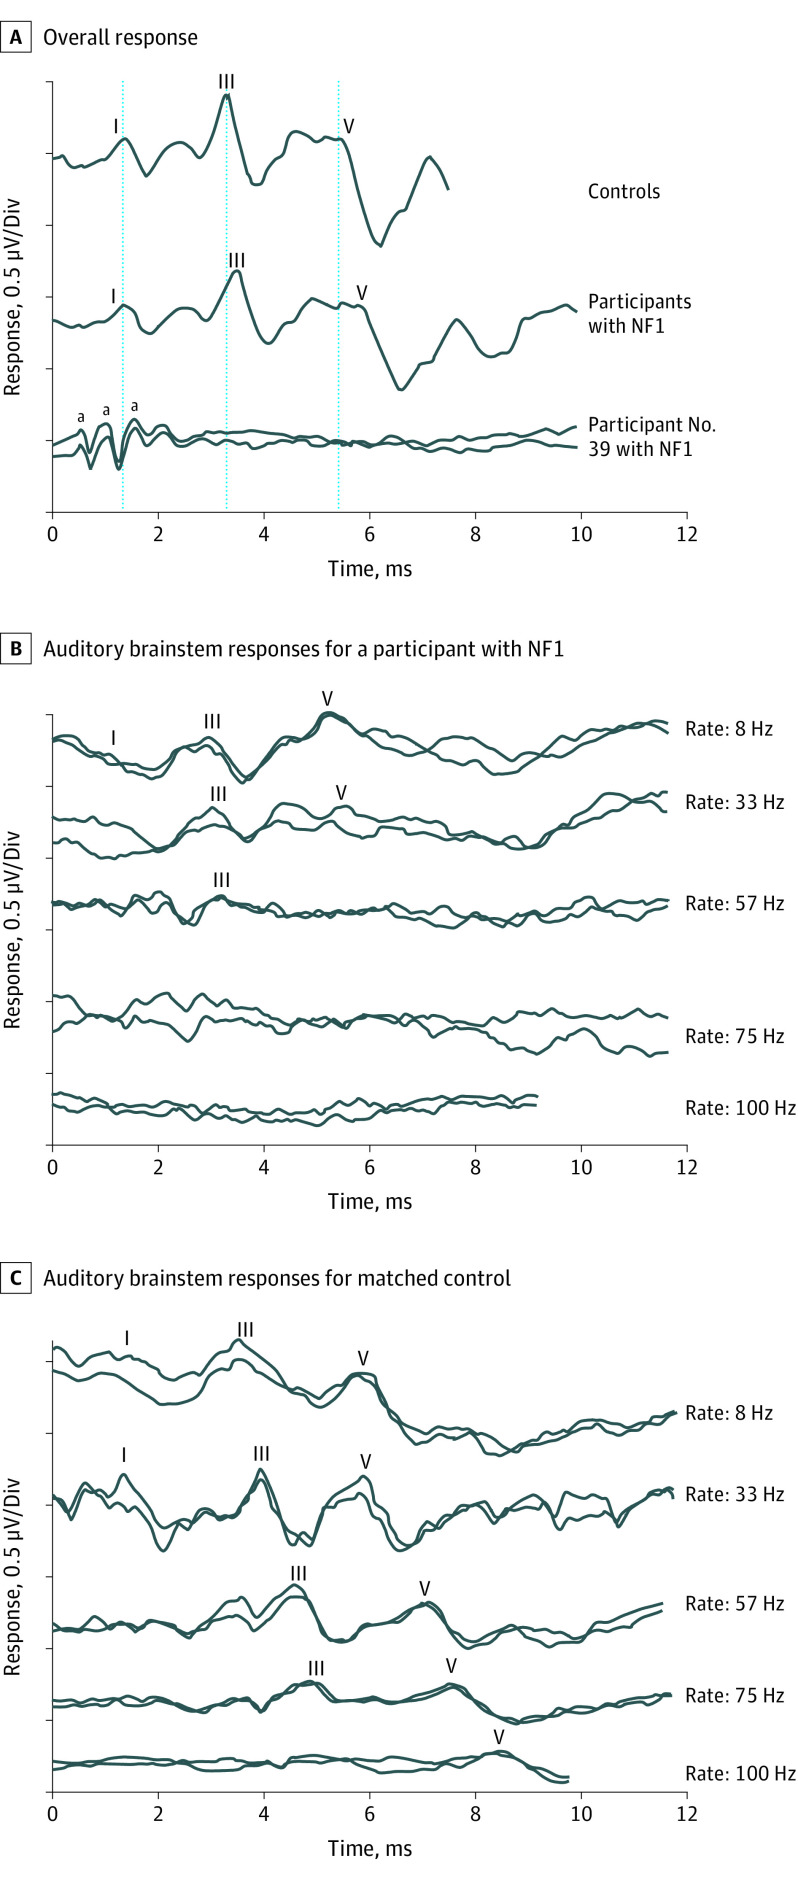
Figure 1. Average Auditory Brainstem Response Waveforms for Neurofibromatosis 1 (NF1) and Control Cohorts.
A, The bottom tracings show present cochlear microphonic responses and absent auditory neural potentials for participant 39 in the NF1 cohort. (The cochlear microphonic is a scalp-recorded electrical potential generated by the polarization and depolarization of cochlear hair cells.) B and C, Auditory brainstem responses for a participant with NF1 (B) and her matched control participant (C) to acoustic click stimuli at presentation rates ranging from 8 Hz to 100 Hz.
aPositive peaks in the cochlear microphonic waveform.

