
Figure 2. Fixel-Based Analysis Results.
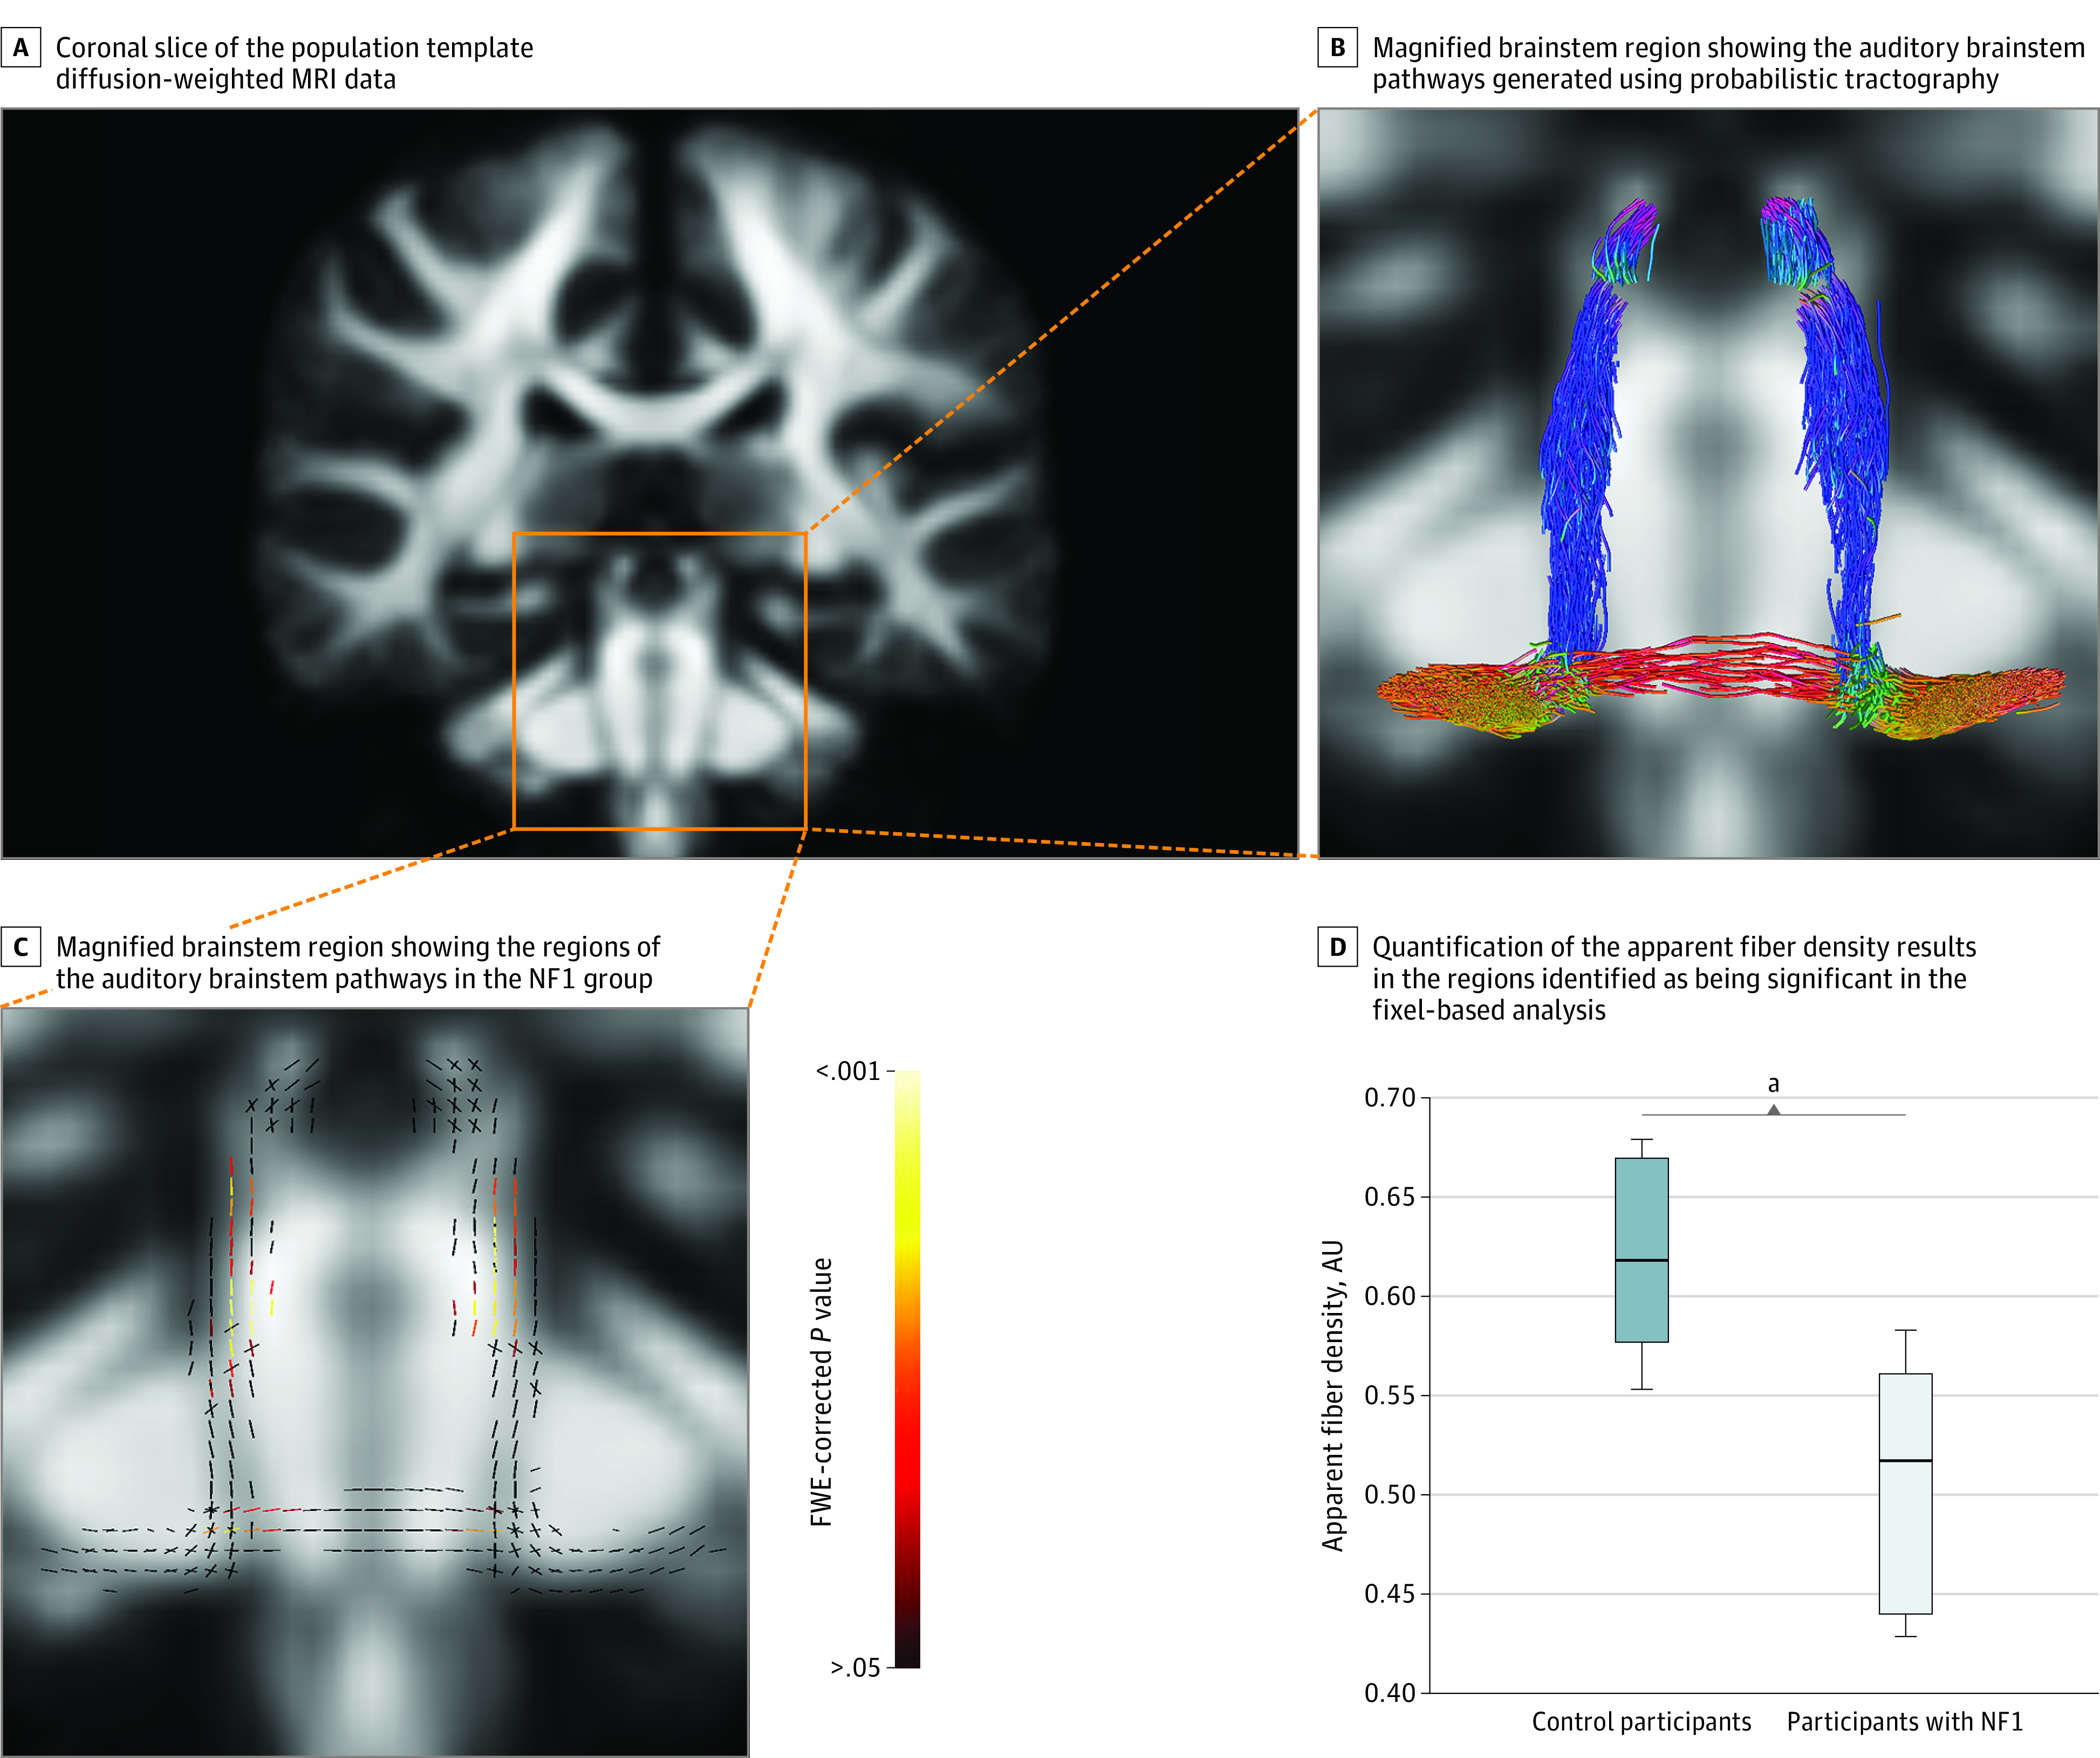
A, Coronal slice of the population template diffusion-weighted magnetic resonance imaging (MRI) data, with the box indicating the brainstem where the analysis was performed. B, Magnified brainstem region showing the auditory brainstem pathways (generated using probabilistic tractography)22 in which apparent fiber density was compared between the neurofibromatosis type 1 (NF1) group and control group.21 The different colors of the tracts in this image correspond to tract orientation and adhere to the directionally encoded color convention: anterior-posterior is green, superior-inferior is blue, and left-right is red. C, Magnified brainstem region showing the regions of the auditory brainstem pathways in the NF1 group that exhibited significantly lower apparent fiber density (ie, presence of neural degeneration) compared with the control group. This image shows the auditory pathways as fixels (individual fiber populations in a voxel), which are color-coded based on familywise error (FWE)–corrected P values. D, Quantification of the apparent fiber density results in the regions identified as being significant in the fixel-based analysis (C). Values are represented in arbitrary units (AUs). These boxplots present the median (center line), the interquartile range (shaded area of the box), and whiskers (range) of the data.
aP < .001.