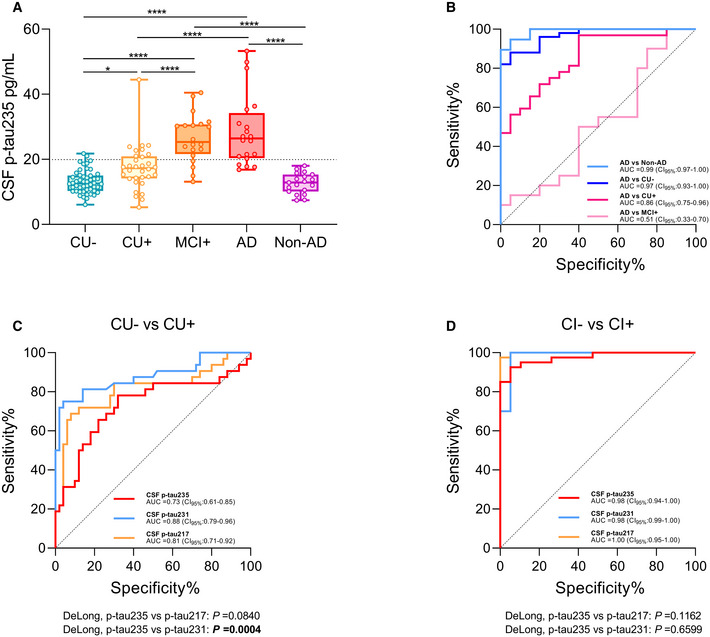
Figure 3. CSF p‐tau235 assay across Alzheimer’s disease continuum (TRIAD cohort).

- Box‐and‐whiskers plot showing CSF p‐tau235 concentrations in the different groups: amyloid‐negative cognitively unimpaired (CU−) participants (n = 50), participants across Alzheimer’s disease (AD) continuum (amyloid‐positive cognitively unimpaired (CU+, n = 32); amyloid‐positive mild cognitive impairment (MCI+, n = 20); AD (n = 20) and non‐AD cases (n = 19)). CSF p‐tau235 is highly specific for AD pathology. Cut‐off value for CSF p‐tau235 positivity is displayed with black dashed line (19.92 pg/ml).
- ROC analysis showing the high diagnostic accuracy of CSF p‐tau235 discriminating AD from CU−, CU+, MCI+ and non‐AD groups.
- ROC analysis comparing AUC values of CSF p‐tau235, p‐tau231 and p‐tau217 discriminating CU+ from CU−. CSF p‐tau235 discriminating accuracy was statistically lower than that of CSF p‐tau231, but not CSF p‐tau217.
- ROC analysis comparing AUC values of CSF p‐tau235, p‐tau231 and p‐tau217 discriminating amyloid‐negative cognitively impaired (CI−, non‐AD) from amyloid positive cognitively impaired (CI+, MCI+ and AD). CSF p‐tau235 performance was statistically similar to that of CSF p‐tau217 and p‐tau231.
Data information: Box‐and‐whisker plots show the median and the 25th and 75th percentiles. P‐values determined using one‐way ANOVA adjusted by age and sex followed by Bonferroni‐corrected post‐hoc comparison (*P < 0.05, ****P < 0.0001). CSF p‐tau235 cut‐off was determined as mean ± 2 SD of the A−T− group in ALFA+ cohort (19.92 pg/ml). ROC analysis (B–D) indicating the diagnostic accuracy of the studied biomarkers as AUC values. The DeLong test (C, D) was used to determine statistical differences between biomarker performances (P < 0.05 is indicated in bold). All samples were run in singlicates.
