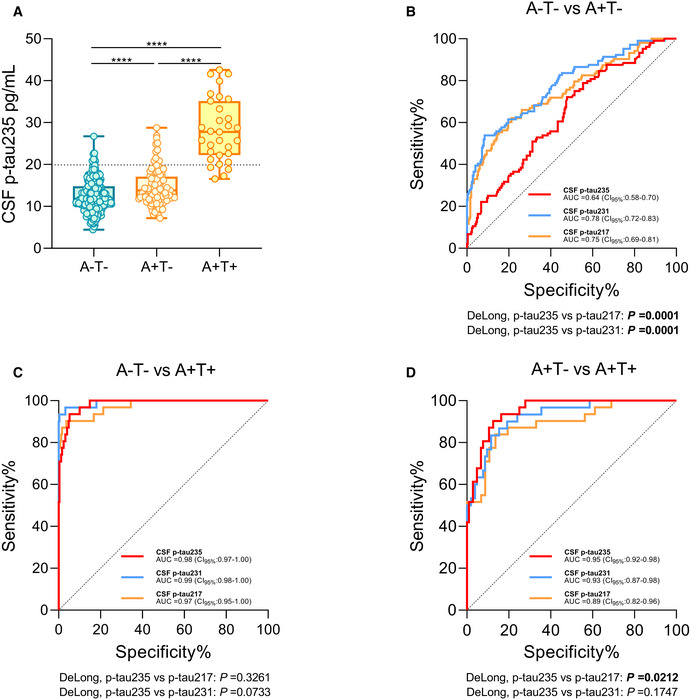
Figure 4. CSF p‐tau235 assay across preclinical Alzheimer’s disease (ALFA+ cohort).

- Box‐and‐whiskers plot showing CSF p‐tau235 concentrations in A−T− participants and across preclinical Alzheimer’s disease (AD, dichotomised as A+T− and A+T+). CSF p‐tau235 was increased already in A+T−, which represents the early cases within preclinical AD. A prominent increase was observed from A+T− to A+T+, the latter representing late preclinical AD cases. Cut‐off value for CSF p‐tau235 positivity is displayed with black dashed line (19.92 pg/ml).
- ROC analysis comparing AUC values of CSF p‐tau235, p‐tau231 and p‐tau217 discriminating A−T− from A+T−. Both CSF p‐tau217 and p‐tau231 showed a statistically higher accuracy discriminating A−T− from A+T− than CSF p‐tau235.
- ROC analysis comparing AUC values of CSF p‐tau235, p‐tau231 and p‐tau217 discriminating A−T− from A+T+. All three assays had statistically the same accuracy when distinguishing A−T− from A+T+.
- ROC analysis comparing AUC values of CSF p‐tau235, p‐tau231 and p‐tau217 discriminating A+T− from A+T+. CSF p‐tau235 demonstrated statistically superior diagnostic accuracy compared with CSF p‐tau217 discriminating the two preclinical groups (A+T− and A+T+). In this scenario, no differences in diagnostic performance between CSF p‐tau235 and p‐tau231 were observed.
Data information: Box‐and‐whisker plots show the median and the 25th and 75th percentiles. P‐values were determined using one‐way ANOVA adjusted by age and sex, followed by Bonferroni‐corrected post‐hoc comparison (****P < 0.0001). The CSF p‐tau235 cut‐off was determined as the mean ± 2 SD of the A−T− group in ALFA+ cohort (19.92 pg/ml). ROC analysis (B–D) indicating biomarker diagnostic accuracy as AUC values. The DeLong test (B–D) was used to determine statistical differences between biomarker performances (P < 0.05 is indicated in bold). All samples were run in singlicates.
