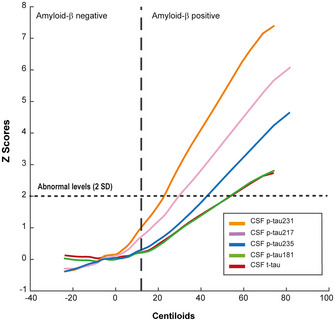
Figure 5. CSF biomarker trajectories in preclinical AD.

Trajectories of the different tau biomarkers in preclinical AD using a local weighted regression method (Loess curve). Changes on biomarker levels in CSF are represented as z‐scores using Aβ PET in Centiloid scale (CL) as a proxy of disease progression. Abnormal biomarker levels were determined as two standard deviations (SD) above the mean. Incipient Aβ pathology positivity was determined as Aβ PET higher than CL 12 (Mila‐Aloma et al, 2020). All samples were run in singlicates.
