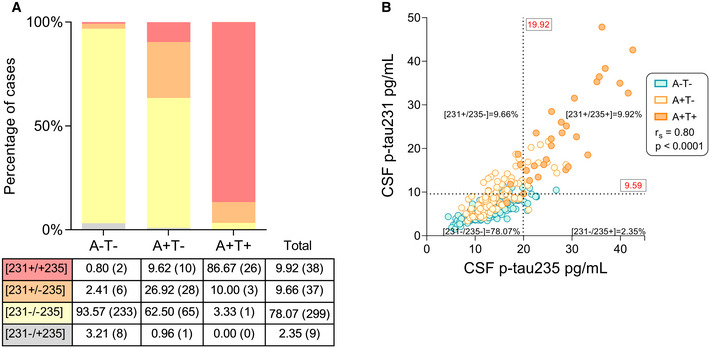
Figure 6. CSF p‐tau231 and p‐tau235 sequential phosphorylation in ALFA+ (preclinical AD).

- Stacked bar chart depicting the percentages of [231+/235+], [231+/235−], [231−/235−] and [231−/235+] cases in each preclinical group. Table below indicates the exact percentages of participants in each group (exact number of participants in parenthesis). Discordant cases with the sequential phosphorylation hypothesis [231−/+235] are shown in grey.
- Correlation between CSF p‐tau235 and p‐tau231 in the whole ALFA+ cohort (Spearman’s rank correlation: r S = 0.80, P˂0.0001). Assay cut‐offs were determined as the mean ± 2 SD of the A−T− group (defining p‐tau231 and p‐tau235 positivity or negativity in each participant). Cut‐off values are indicated in red (19.92 and 9.59 pg/ml for CSF p‐tau235 and p‐tau231, respectively) and displayed with black dashed lines, resulting in four quadrants, each of them representing the four different positive or negatively status for each biomarker. Discordant cases with the sequential phosphorylation hypothesis ([231−/+235]) are shown on the lower right quadrant (2.35% of the total, 9 participants out 383). All samples were run in singlicates.
