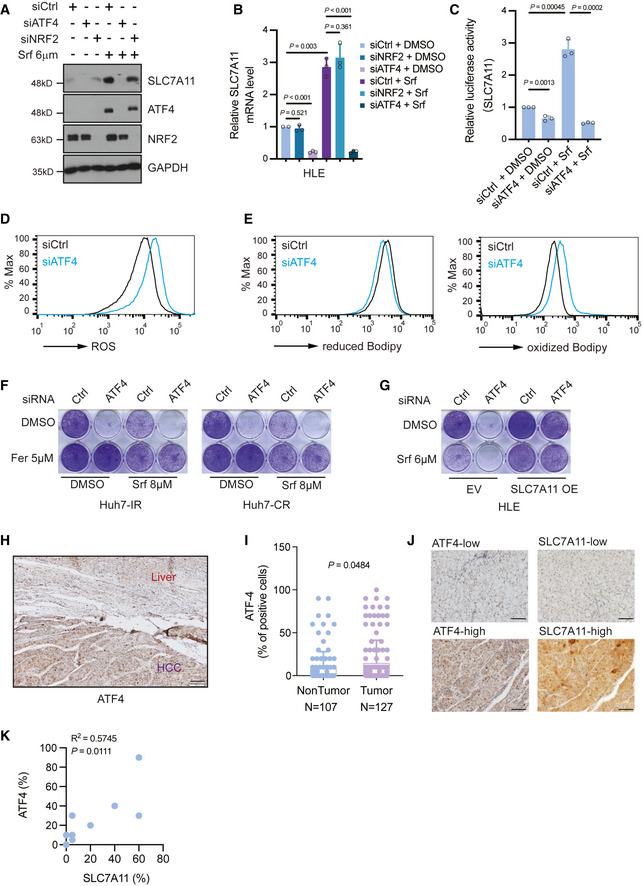
Figure 3. ATF4 regulates SLC7A11 in response to Sorafenib treatment.

- SLC7A11 protein levels decreased upon siRNA‐mediated depletion of ATF4 but not of NRF2 either with or without Sorafenib treatment, and Sorafenib promoted the expression of ATF4. HLE cells were transfected with siCtrl, siATF4 or siNRF2 and treated with or without 6 μM Sorafenib for 18 h. The expression of SLC7A11, ATF4, and NRF2 was determined by immunoblotting. GAPDH served as loading control. Results represent three independent experiments.
- SLC7A11 mRNA levels were decreased upon ATF4 depletion but not NRF2 depletion. HLE cells were transfected with siCtrl, siATF4, or siNRF2 and cultured with DMSO or 6 μM Sorafenib for 18 h. Quantitative RT‐PCR was used to determine SLC7A11 mRNA levels. Data are shown as mean ± standard deviation (SD). Statistical significance was calculated using one‐way ANOVA. Results represent three independent experiments.
- siRNA‐mediated ablation of ATF4 significantly reduced SLC7A11 promoter activity, as determined by SLC7A11‐promoter‐luciferase reporter assay. HLE cells were transfected with SLC7A11‐promoter firefly luciferase reporter construct and a constitutive‐active Renilla luciferase reporter construct (pRL‐CMV) and with siCtrl or siATF4 and treated or not with 6 µM Sorafenib. Relative luciferase activity was measured using the Dual‐Luciferase Reporter Assay Kit (Promega E1980). Data are shown as mean ± standard deviation (SD). Statistical significance was calculated using one‐way ANOVA. Results represent three independent experiments.
- Basal reactive oxygen (ROS) levels increased upon loss of ATF4. HLE cells were transfected with siCtrl or siATF4 and cultured for 36 h were stained with CellROX™ Green Flow Cytometry Assay Kit, ROS levels were measured by flow cytometry using a 488 nm laser. Results represent three independent experiments.
- Basal lipid peroxidation levels increased with the loss of ATF4. HLE cells were transfected with siCtrl or siATF4 and cultured for 36 h were stained with C11‐BODIPY 581/591. Reduced‐Bodipy was measured by flow cytometry using a 488 nm laser, and oxidized‐Bodipy was measured with a 561 nm laser. A significant shift of oxidized‐Bodipy occurred upon depletion of ATF4. Results represent three independent experiments.
- Colony formation assay demonstrating that the ferroptosis inhibitor Ferrostatin‐1 (Fer) reversed Sorafenib‐induced cell death in ATF4‐deficient HCC cells. HLE cells transfected with siCtrl or siATF4 were treated with Sorafenib (8 μM) or DMSO plus either DMSO or Ferrostatin‐1 (Fer; 5 μM) for 2 weeks. Results represent three independent experiments.
- The forced expression of SLC7A11 rescued from cell death induced by ATF4 ablation. HLE cells were transfected with a construct coding for SLC7A11 (SLC7A11 OE) or empty vector (EV) and with siCtrl or siATF4 every other day. Cells were then treated with either DMSO or 6 μM Sorafenib for 2 weeks. Colony formation was visualized by crystal violet staining. Results represent three independent experiments.
- Immunohistochemical staining of ATF4 in HCC and adjacent non‐neoplastic areas from patients. Tumor tissues showed a higher expression of ATF4. Scale bar, 100 μm.
- Quantification of ATF4‐positive cells in tumor and non‐tumor samples showed that HCC tumors present higher ATF4 levels. Data are shown as mean ± standard deviation (SD). Statistical significance was calculated using unpaired t‐test.
- Representative images of immunohistochemical staining of ATF4 and SLC7A11 proteins in HCC samples from patients. Scale bars, 50 μm.
- Quantification of the immunohistochemical stainings in (J) showed a positive correlation of ATF4 and SLC7A11 expression (N = 10). Statistical significance was calculated using Pearson correlation analysis.
Source data are available online for this figure.
