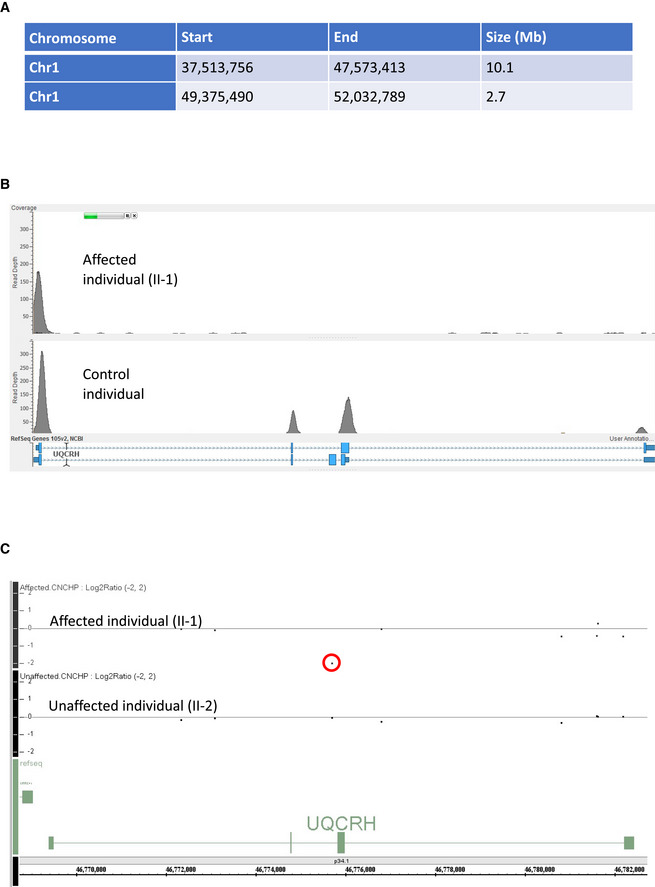
Figure EV1. Exome sequence analysis.

- Table detailing the homozygous regions identified in the two affected first cousin individuals.
- Read depth image from exome sequence data from the affected individual (II‐1) demonstrating absences of sequence reads encompassing exons 2 and 3 of UQCRH (upper panel) and evidence of sequence reads for both exons in an unrelated control (lower panel).
- Log2 ratio SNP microarray results show the absence of signal for a single probe between exons two and three of UQCRH (indicated by a red circle) in an affected individual (II‐1) upper track and evidence of two copies of this probe in their unaffected sibling (II‐2) in the lower track.
