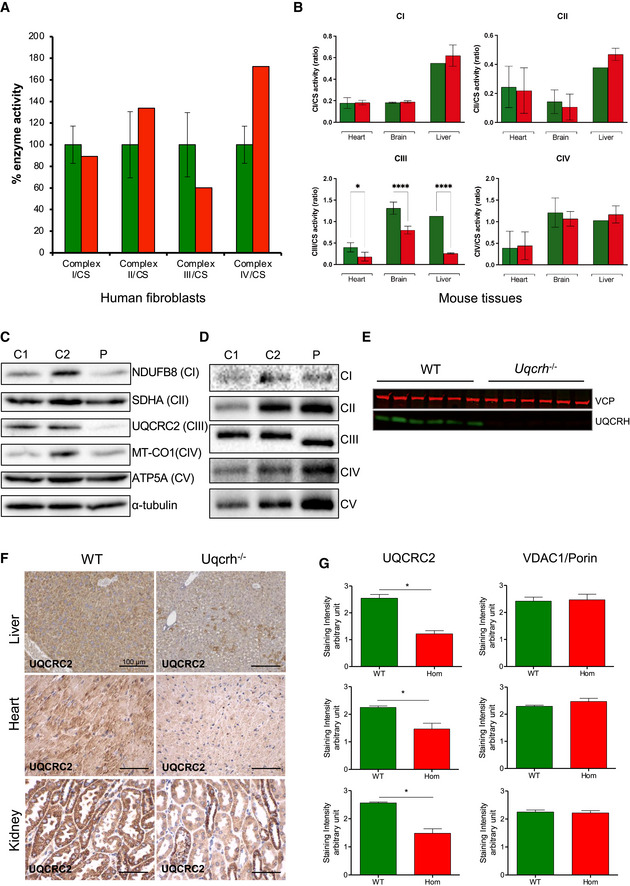
Figure 3. Biochemical assessment of patient fibroblasts and Uqcrh −/− mice shows impaired complex III activity and stability.

- Respiratory chain enzyme activities from human control (green) and patient (red) fibroblasts. Mean activities of controls (n = 8) are set to 100% and error bars represent 1 standard deviation. Data are normalised to citrate synthase (CS) activity.
- Respiratory chain enzyme activities in heart, brain and liver, of wild‐type and Uqcrh −/− mice. Data are normalised to citrate synthase (CS) activity. Values are given as mean ± SD, n = 4 WT, 5 Uqcrh −/− (heart), 3 WT, 3 Uqcrh −/− (brain), 1 WT and 2 Uqcrh −/− (Liver). *P < 0.05, ****P < 0.0001, 2‐way ANOVA (multiple comparisons). Data showing CS activity/total protein concentration can be found in Appendix Fig S1A.
- Western blot analysis of OXPHOS components in the patient (P) and control (n = 2, C1‐2) fibroblasts.
- BN‐PAGE analysis of OXPHOS complex assembly in enriched mitochondria from patient and control fibroblasts (n = 2, C1‐2) solubilised with DDM. Immunoblotting was performed using antibodies to a subunit of each complex (CI [NDUFB8], CII [SDHA], CIII [UQCRC2], CIV [MT‐CO1] and CV [ATP5A]).
- Western blot analysis of liver lysates derived from 6 wild‐type (WT) and 6 Uqcrh −/− animals at 4 weeks of age. The upper band (97 kDa) refers to loading control VCP protein; the lower band (11 kDa) indicates UQCRH.
- Immunohistochemical staining of UQCRC2 was performed on liver, heart and kidney derived from wild‐type and Uqcrh −/− mice at 9 weeks of age. Staining of VDAC1/porin was also carried out (Appendix Fig S1B).
- Graphs indicate score values of immunohistochemical staining intensity of both VDAC1/porin and UQCRC2. Data are given as mean ± SEM. *P < 0.05; n = 3, Student’s t‐test (unpaired samples).
Source data are available online for this figure.
